Mathematics Education with
Digital Technology
Other Titles in the Education and Digital Technology Series
Drama Education with Digital Technology, Michael Anderson, John Carroll
and David Cameron
Foreign Language Learning with Digital Technology, Michael Evans
Music Education with Digital Technology, John Finney and Pamela Burnard
Also available from Continuum
Teaching Mathematics Using ICT, Adrian Oldknow, Ron Taylor and Linda
Tetlow
Mathematics Education with
Digital Technology
Education and Digital Technology
Edited by
Adrian Oldknow and Carol Knights
Continuum International Publishing Group
The Tower Building
80 Maiden Lane
11 York Road
Suite 704, New York
London SE1 7NX
NY 10038
www.continuumbooks.com
© Adrian Oldknow, Carol Knights and Contributors 2011
All rights reserved. No part of this publication may be reproduced or transmitted in any
form or by any means, electronic or mechanical, including photocopying, recording, or any
information storage or retrieval system, without prior permission in writing from the
publishers.
Adrian Oldknow, Carol Knights and Contributors have asserted their right under the
Copyright, Designs and Patents Act, 1988, to be identiied as Author of this work.
British Library Cataloguing-in-Publication Data
A catalogue record for this book is available from the British Library.
EISBN: 978-1-4411-8900-4
Library of Congress Cataloging-in-Publication Data
Mathematics education with digital technology / edited by Adrian Oldknow and Carol
Knights.
p. cm. – (Education and digital technology series)
Includes bibliographical references and index.
ISBN 978-1-4411-8472-6 (hardcover) – ISBN 978-1-4411-8900-4 (ebook (pdf))
1. Mathematics–Study and teaching (Middle school)–Technological innovations.
2. Electronic instruments, Digital. I. Oldknow, A. J. (Adrian James), 1946- II. Knights, Carol.
QA11.2.M2779 2011
510.71—dc22
Typeset by Newgen Imaging Systems Pvt Ltd, Chennai, India
Printed and bound in Great Britain
2010033395
Contents
ix
xix
xxi
xxii
Notes on Contributors
Series Editor’s Foreword
Acknowledgements
Introduction
Part 1
Chapter 1
Chapter 2
Chapter 3
Chapter 4
The Neuroscience of Connections,
Generalizations, Visualizations and Meaning
Edward D. Laughbaum
Chapter 6
3
ICT in the United States: Where We Are Today and a
Possibility for Tomorrow
Gail Burrill
12
ICT in France: Development of Usages, Institutional
Hesitations and Research Questions
Luc Trouche and Ghislaine Gueudet
23
ICT and the English Mathematics Curriculum
Sue Pope
Part 2
Chapter 5
Where Are We Now?
30
What Does Research Tell Us?
The Value of Learning Geometry with ICT: Lessons
from Innovative Educational Research
Keith Jones
Learning Mathematics Using Digital Resources:
Impacts on Learning and Teaching for 11- to
14-year-old Pupils
Don Passey
39
46
vi
Contents
Chapter 7
Improving on Expectations: Preliminary Results from
Using Network-supported Function-based Algebra
Walter Stroup, Lupita Carmona and Sarah M. Davis
Part 3
Chapter 8
Chapter 9
61
Key Pedagogical Issues in Embedding ICT in
Teaching and Learning Mathematics
Designing Substantial Tasks to Utilize ICT in
Mathematics Lessons
Colette Laborde
Learning from Acting on Objects
John Mason
Chapter 10 A Case Study of Using Multiple Resources to Teach
Straight Line Graphs
Rosemary Deaney and Sarah Hennessy
Part 4
75
84
101
Description of a Range of ICT Tools
Chapter 11 Emerging Technologies for Learning and Teaching
Vanessa Pittard
111
Chapter 12 Home and School – Bridging the Gap
Russell Prue
118
Chapter 13 Personal Portable Technology
Adrian Oldknow and Peter Hamilton
123
Part 5
Practical Ideas of ICT to Enhance
Teaching and Learning
Chapter 14 Linking the Mathematics Curriculum to Software,
Resources and Strategies to Engage Teachers and
Learners in Using ICT in the Classroom
Linda Tetlow
Chapter 15 The Uses of Online Resources for Teaching and
Learning Mathematics at Advanced Level
Bryan Dye
Chapter 16 What Do the Subject Associations Offer?
Ruth Tanner
135
148
157
Contents
Chapter 17 Modelling, Functions and Estimation: A Pizza Problem
Chris Olley
Part 6
vii
163
ICT Supporting Cross-curricular Work
with Mathematics
Chapter 18 Using Video Analysis to Develop Modelling
Skills in Physics
Steve Hearn
177
Chapter 19 Bloodhound SSC: A Vehicle for STEM
Ian Galloway
185
Chapter 20 Modelling Action in Sports and Leisure
Matt Pauling and Adrian Oldknow
192
Part 7
Case Studies of Teachers Engaging with ICT
Chapter 21 Teaching International Baccalaureate Mathematics
with Technology
Jim Fensom
Chapter 22 Why Use Technology to Teach Mathematics?
Andy Kemp
205
213
Chapter 23 Using ICT to Support Learning Mathematics in
the Primary Classroom
Mel Bradford and Tina Davidson
220
Chapter 24 The Role of a Head of Mathematics Department in
Ensuring ICT Provision and Use within Lessons
Dawn Denyer and Carol Knights
230
Chapter 25 Developing Problem Solving Skills and Cross-curricular
Approaches in Mathematics Utilizing ICT
Michael Hartnell and Carol Knights
234
Part 8
Implications for Professional Development
Chapter 26 Supporting Developments within a Local Authority
Ron Taylor
241
Chapter 27 Supporting Teachers in Introducing New Technologies
Alison Clark-Wilson
251
viii
Contents
Chapter 28 Implications for Professional Development: Supporting
Individuals
Pip Huyton
257
Chapter 29 What Are the Signiicant Factors Which Support the
Integration of ICT in the Mathematics Classroom?
David Wright and Pat Woolner
261
Glossary
Index
268
271
Notes on Contributors
Mel Bradford is a primary school teacher working at a school in Brighton,
UK. She has worked in various state schools in the United Kingdom and
completed her PGCE at Sussex University in 1991. During her career, Mel
has been a co-ordinator for mathematics and assessment. She is currently
ICT co-ordinator. As mathematics was her degree subject, she has always
been interested in promoting mathematical understanding with primary
school children.
Gail Burrill, a former secondary teacher and department chair, is currently
a Mathematics Specialist in the Division of Science and Mathematics Education at Michigan State University. She served as President of the National
Council of Teachers of Mathematics and as Director of the Mathematical
Sciences Education Board. She has been involved in using graphing calculators in teaching mathematics since their advent, is an instructor for Teachers Teaching with Technology, and serves as a senior mathematics advisor to
Texas Instruments Education Technology. Gail has written and edited many
books and articles on teaching and learning statistics and spoken nationally
and internationally on issues in teaching and learning mathematics. Her
research interests are the use of technology in teaching secondary mathematics, statistics education at the secondary level, and issues related to the
professional development of teachers.
Lupita Carmona is a native of Mexico. Dr. Carmona has an impressive
record of professional leadership and research both in Mexico and the US.
Dr. Carmona worked for the Ministry of Education in Mexico in leading
national incentives for educational reform through the implementation of
new technologies. Later she obtained her doctoral degree in Mathematics
Education at Purdue University. Her research focuses on student learning,
curriculum development, and evaluation and assessment, with heavy
emphasis on collaborative learning and distance education. Dr. Carmona
teaches in the UTeach secondary certiication programme and the graduate programme in Science and Mathematics Education in the University of
Texas at Austin.
x
Notes on Contributors
Alison Clark-Wilson is principal lecturer in Mathematics Education in The
Mathematics Centre, University of Chichester, UK. Her research is focused
on the development of ICT resources and approaches within secondary
mathematics education and, in particular issues concerning teachers’ professional development. She has directed a number of research projects in
this area. Her publication Exciting ICT in Mathematics Network Continuum
Education (2005) provides a useful guide for teachers who are developing
their use of technology in the mathematics classroom.
Tina Davidson is a primary school teacher currently working at a school in
Brighton, UK. She has worked in various state nursery, infant and primary
schools in England and spent a year teaching in Australia. She qualiied as
a teacher in 1986 with a Bachelor of Education degree with Honours. During her career, Tina, has co-ordinated ICT, Literacy, Assessment, Early Years,
Self-evaluation and currently mathematics. Tina enrolled on a part-time
MA in Mathematics Education in 2008 at the University of Chichester where
she developed an interest in developing children’s mathematical ability
through the use of ICT.
Sarah M. Davis is a faculty researcher at the Singapore Learning Sciences
Lab at (NIE), an institute of Nanyang Technological University. Dr. Davis
received her undergraduate degree in communications from Concordia
University and her masters and doctorate in mathematics education from
the University of Texas at Austin. Between her undergraduate work and
beginning her doctorate, she was a classroom teacher for 6 years, having
taught regular, special education and gifted mathematics at both the middle school and high school levels. In addition to teaching mathematics, Dr
Davis also taught 1 year of regular education third grade. More recently
she’s had years of experience introducing and supporting near-term innovation in schools serving at-risk populations, substantial background working with teachers in both pre-service and in-service settings across the US,
extended research participation in the Participatory Simulations Project
funded by the National Science Foundation (NSF), an effort funded by the
NSF to research and develop – with Texas Instruments – a new, wireless,
networked classroom technology aimed at transforming the classroom as a
dynamic learning environment. During a leave of absence from the University of Texas, Dr Davis worked for Texas Instruments, Inc. on the creation
and release of the TI Navigator ™ classroom network. She co-ordinated the
pilot site community working with 60 teachers at 30 schools in 20 states,
making sure that the teachers using the pre-release version of the system
were supported and successful in using the technology. During her last year
Notes on Contributors
xi
at TI she worked as a Project Manager, organizing multiple development
teams to facilitate the initial release of the TI Navigator product. Currently,
extending her dissertation work, she is developing a research agenda
focused on function-based algebra, classroom networks, generative activities and their design, teacher professional development, group dynamics
and the use and affordances of anonymity in the classroom.
Rosemary Deaney is a senior teaching associate in the Faculty of Education,
University of Cambridge. With a background in teaching across a range of
educational sectors, she has a research interest in the use of digital technologies in subject teaching and learning. She has worked as Research
Associate on several collaborative projects in this area, including supporting teachers developing their practice with technology tools.
Dawn Denyer has 13 years experience of teaching in the south of England.
She started her teaching career in a large ‘traditional’ comprehensive, and
has since taught or led in Specialist Technology Colleges. She is currently
Mathematics Subject Leader in a designated Arts College. Dawn enjoys
using technology in her classroom to engage and motivate her students,
and encourages other teachers to do the same.
Bryan Dye is a former mathematics teacher of 28 years experience in comprehensive schools, including a period as advisory teacher for Norfolk. He
has authored published teaching resources for spreadsheets and Omnigraph and for about 7 years contributed the WebWatch column to ATM’s
termly magazine. Since the late 1990s he has developed interactive websites
under the MathsNet name and is currently working on advanced mathematics www.mathsnetalevel.com/, a site catering for students and teachers
of A-level, International Baccalaureate and other similar courses.
Jim Fensom is a mathematics teacher at an international school: the United
World College of South East Asia, Singapore. He graduated from Southampton University with a BSc degree in Mathematics and subsequently a
part time MEd degree from Shefield University. With over 30 years of experience of teaching mathematics at all levels in the International Baccalaureate, Jim has been consulted by examination boards and calculator
manufacturers. He specializes in the effective use of technology in the
teaching of mathematics such as graphing calculators, data loggers and
electronic whiteboards.
Ian Galloway is Deputy Director at the Science Learning Centre South East
based in the University of Southampton. He is also Education Director for
BLOODHOUND SSC and sees this type of project as a great hook on which
xii
Notes on Contributors
to hang children’s learning. Ian is very keen to promote the place of mathematics within science education and believes that it is not possible to offer
a coherent science education to children without integrating mathematics.
He worked within the state and private sectors for over 30 years before moving into teacher training and professional development.
Ghislaine Gueudet is full professor at IUFM Bretagne (teacher training
institute). She is vice-director of the CREAD (Center for Research on Education, Learning and Didactics), and member of its ICT research axis. Her
interest for ICT started with the didactical study of the use of e-exercises
bases, from grade 3 to mathematics master degree. It led her then, in a joint
work with Luc Trouche, to consider all the resources intervening in the
teacher’s activity. They introduced an approach for the study of mathematics teachers’ documentation work. They still work on the development of
this approach, and simultaneously implement it in different research
projects.
Peter Hamilton is the Head of Education Development with Intel Performance Learning Solutions. Peter has over 25 years experience in the IT
Industry and has been with Intel since 1991 where he has worked in a in a
variety of manufacturing, quality management, and technology development roles in both Ireland and the US. In 1998 Peter was a founder member of Intel Performance Learning Solutions. He has led the education
research, design and development activities which have delivered the award
winning skoool™ Learning and Teaching technologies. This is now a worldwide programme which provides valuable learning and teaching resources,
technologies and strategic approaches in 7 languages and is now operating
in more than 30 countries. Peter has consulted on emerging education
technologies in North America, Europe, the Middle East, Africa and Asia
and has published papers on mobile and technology-based learning. Peter
has a Masters Degree in Engineering from University College Dublin. In
2004 Peter was joint recipient of the Digital Media Person of the Year Award
at Ireland’s National Digital Media Awards for his work with the ‘skoool’
Learning and Teaching Technologies.
Michael Hartnell is Head of Department in an 11 to 16 school in Southern
England. He has been involved with a number of local and national developmental projects and has appeared on Teachers’ TV showcasing lessons
which utilize ICT in contextualized problem solving activities.
Steve Hearn is a physics teacher and housemaster at Charterhouse school.
He has been involved in developing novel physics investigations using
Notes on Contributors
xiii
computer modelling, video and data logging as well as rulers and blu-tac!
He is also an Institute of Physics network co-ordinator in Surrey, an SEP
teacher fellow and he runs the summer residential Subject knowledge
booster courses in Chemistry and Physics at Charterhouse.
Sara Hennessy is a lecturer in Teacher Development and Pedagogical Innovation at the University of Cambridge. Her research over the last couple of
decades into subject teaching and learning using a range of classroom technologies seeks to understand and develop pedagogy, especially related to
mathematics and science education. She has recently explored the potential of the interactive whiteboard to support classroom learning through
dialogue. Her work also focuses on research partnerships and on practitioner-led professional development in UK and African schools.
Pip Huyton is an Independent Mathematics Advisor. Since 1996 her work in
Mathematics for Local Authorities, Ark Academies, Becta, the Mathematical Association and the Department for Children Schools and Families has
included Professional Development provision for teachers and project
management. She is recognized as meeting the National Centre for the
Excellence in the Teaching of Mathematics (NCETM) Quality Standard for
CPD providers and is an NCETM Associate. Pip has a particular interest and
expertise in the effective use of ICT in the teaching and learning of Mathematics, and wide experience in developing collaborative networks of
teachers.
Keith Jones is Associate Professor of Mathematics Education at the School
of Education, University of Southampton, UK, where he is head of the university’s Mathematics and Science Education Research Centre. His research
expertise encompasses the acquisition and use of mathematical knowledge
in different cultural settings, the development of mathematical reasoning
in students, and the integration of technology in the teaching and learning
of mathematics. He has published widely, including co-editing complete
volumes on technology in mathematics education for the International Journal of Technology in Mathematics Education and the international journal Educational Studies in Mathematics. He has been a member of the thematic group
on Tools and Technologies in Mathematical Didactics of the European Society for
Research in Mathematics Education (ERME) since its inception, and, from
2000–2003, he led the group. For up-to-date information, see: www.crme.
soton.ac.uk.
Andy Kemp is a secondary school mathematics teacher and is currently
Head of Mathematics at Taunton School, Somerset, UK. He studied his
xiv
Notes on Contributors
Mathematics degree at Warwick University later returning there to complete his PGCE in 2005 and then a part-time MSc in Mathematics Education
in 2008. His academic interests focus on the appropriate use of technology
in the mathematics classroom, with his MSc research being related to computer algebra usage within secondary schools. He is particularly interested
in the potential impact of the internet on mathematics education.
Carol Knights is a Principal Lecturer in mathematics education at the University of Chichester, teaching on undergraduate and Masters level courses.
She gained experience as a teacher working for 14 years in Hampshire as
Head of Department and Advanced Skills Teacher, teaching across the
11–18 age range and working with a range of schools to improve attainment
and engagement in mathematics. She has wide expertise in the use of ICT
in the classroom and has authored resources for both the Bowland Key
Stage 3 mathematics initiative and the GE STEM Achievement in Mathematics
London Pilot. She currently leads the Chichester team in co-ordinating the
work of the NCETM in the South East Region.
Colette Laborde is currently Professor Emeritus at the University Joseph
Fourier, Grenoble, France. Her research work in mathematics education deals
with the integration of the computer in the teaching and learning of geometry and she is involved in the project Cabri-géomètre, dynamic geometry software programs for plane geometry and 3D geometry, distributed across the
world. She was the co-chair of the Topic Study Group on ‘New technologies in
the Learning and Teaching of Mathematics’ at the 11th International Congress in Mathematics Education (ICME11) in July 2008. She edited several
books in mathematics education and she is a member of several Editorial
Boards of International Journals in Mathematics Education
Ed Laughbaum is an emeritus professor of mathematics, and is currently
the director of the Early Mathematics Placement Testing Program at The
Ohio State University, US. He is presently interested in the implications of
basic brain processes on understanding and memory/recall as related to
the teaching of algebra with handheld technology. His textbook Foundations for College Mathematics represents a irst iteration of an implementation.
Ed has authored over 50 publications in professional journals or by commercial publishers. He has given over 250 presentations at state, national,
and international conferences.
John Mason is professor emeritus at the Open University and Senior
Research Fellow at the Department of Education in the University of
Oxford. His interests are centred on fostering and sustaining mathematical
Notes on Contributors
xv
thinking, and supporting those who wish to do likewise. He adopts an
explicitly experiential way of working, promoting engagement in mathematics together with relection on the actions and processes, and mental
preparation for acting in an informed manner in the future. He has
authored and co-authored numerous books and pamphlets for teachers,
including Thinking Mathematically, Mathematics as a Constructive Activity,
Designing and Using Mathematical Tasks, and Fundamental Constructs in Mathematics Education.
Adrian Oldknow is Emeritus Professor of Mathematics and Computing
Education at the University of Chichester. He was Open Scholar in mathematics at Hertford College, Oxford University, where he obtained his MA in
mathematics. After teaching mathematics in grammar, comprehensive and
independent schools he moved to a lectureship in mathematics and computing at Reading College of Technology, and took a part-time MTech
degree in Computer Science at Brunel University. He was Head of Mathematics at the Chichester Institute of Higher Education, and awarded a Personal Chair at University College, Chichester. He has held fellowships at
King’s College London, the University of London Institute of Education
and the University Putra Malyasia. He is currently research fellow at the
Amstel Institute, University of Amsterdam. A past editor the IMA journal
Teaching Mathematics and Its Applications, Adrian has written extensively on
the impact of ICT in teaching and learning mathematics. He now works as
a free-lance consultant, and has a particular interest in STEM.
Chris Olley is the director of the secondary mathematics PGCE course at
King’s College, London. He has extensive teaching experience in inner city
comprehensive schools where he embedded the use of graphing calculators and dynamic mathematics software at all levels. He is currently engaged
in research on the variation in take up of different types of interactive mathematics ICT tool amongst PGCE students in the course of their training.
His PhD, in progress, is about engagement with dialogic relations in secondary mathematics classrooms.
Don Passey is a senior research fellow in the Department of Educational
Research at Lancaster University, UK. His research, for government departments and agencies, non-commercial and commercial groups, has focused
on the identiication of teaching and learning outcomes arising from uses of
leading edge technologies, how home and out-of-school practices enhance
and support learning at an individual pupil level, how technologies support
speciic groups of young people (including those at risk), and how evaluation and research can be undertaken to support policy and practice.
xvi
Notes on Contributors
Matt Pauling is a National Development Manager for the Youth Sport Trust,
working with specialist sports colleges to use PE and sport to raise whole
school standards. He has led on the core subjects’ programme for the YST
supporting using sporting contexts, values, skills and pedagogies to improve
motivation, achievement and attainment in English and maths. As a former
PE teacher and keen sportsman he is passionate about the power sport can
have on the engagement and aspirations of young people and the added
value that relevant and accessible new technologies can bring to learning.
Vanessa Pittard is Director of e-Strategy at Becta, leading Becta’s work in
the areas of strategy, research, and technology innovation and futures.
Originally appointed as Director of Evidence and Evaluation, Vanessa has
led Becta’s research since 2004. Prior to working at Becta, Vanessa led the
ICT Research and Evaluation team at DfES, developing and managing a
programme of research to inform the development of technology policy
and strategy. Before 2002, Vanessa had a long career in the University sector, leading the Department of Communication Studies at Shefield Hallam
University before moving into government research.
Sue Pope is programme manager for mathematics at QCDA. She believes
that all learners should have the opportunity to experience mathematics as
the exciting and creative subject that it is. She moved to QCDA after 10
years in higher education at the University of Surrey Roehampton and,
most recently, St. Martin’s College, Lancaster. During that time she worked
with beginning primary and secondary teachers on undergraduate and
postgraduate courses, and supported experienced teachers working towards
higher degrees. For a short time she worked as a local authority adviser
after 10 years teaching in a number of schools, including 5 years as head of
mathematics in an 11–18 mixed comprehensive.
Russell Prue is a well-known ICT Evangelist and popular conference speaker
at education events in the UK and Europe. He is passionate about the use
of ICT in all subjects and is responsible for the invention of the cre8txt
keyboard a T9 USB keyboard for reluctant writers. Russell spends most of
his time motivating and inspiring learning and teaching colleagues to use
technology in a learner centric fashion. He is the author of the presenters’
handbook The Science of Evangelism (2005) and his most recent project is the
creation of an innovative live school radio broadcasting system.
Walter Stroup serves as an Associate Professor of Science, Technology, Engineer and Mathematics Education at The University of Texas at Austin. Much
of his research and on-going school-based implementation efforts focuses
Notes on Contributors
xvii
on a programme of interdisciplinary design and development fusing the
early learning of powerful ideas in mathematics, science and systems theory
with advanced technology design. His work with highly interactive networks
in school classrooms is supported by a theory of generative design that
attends to the senses in which participation in mathematics and science is
both socially structured and socially structuring.
Ruth Tanner is a secondary mathematics consultant with Shropshire Council. She is an enthusiastic user of many different forms of ICT in the classroom and is particularly interested in the creative use of ICT to explore
mathematical concepts. As a member of both the MA and ATM she helped
to found the East Midlands joint branch and is currently an active member
of the Marches joint ATM / MA branch and of the ATM ICT task group.
Ron Taylor is a visiting fellow at Southampton University and a mathematics adviser. He has recently retired from his post as Hampshire inspector/
adviser for mathematics. During his 19 years in Hampshire he has been
responsible for a number of curriculum initiatives of national signiicance,
and is, by invitation, an adviser on two curriculum working parties under
the auspices of the Mathematical Association (MA) and British Educational
Communications and Technology Agency (Becta). This has enabled Ron
to secure funds for a number of projects based in Hampshire schools. He
was a member of the Qualiications and Curriculum Authority’s post-16
mathematics advisory group, and was involved in the formal consultation
of the review of the mathematics National Curriculum, including, classroom-based research on developing pupils’ algebraic and geometrical reasoning. He has been called upon to make representations on proposals for
the future curriculum and assessment for 14–19 year olds. Publications
include joint authorship of Engaging Mathematics, written for the Technology Colleges Trust (now Specialist Schools Trust), and key contributions to
ICT and Mathematics: A Guide to Learning and Teaching Mathematics 11–19
produced for the Teacher Training Agency by the Mathematical Association. He was, by invitation from HMI, part of the team evaluating the impact
of the government initiative on the use of ICT in schools. Ron has been
particularly keen to develop teacher networks as a means of disseminating
effective practice.
Linda Tetlow has many years experience in mathematics teaching both in
secondary and further education in the south of England. This includes
being Head of Mathematics in an 11–18 school, A-level Mathematics coordinator in a Further Education college and Mathematics coordinator for an
xviii
Notes on Contributors
out-of-school learning-on-line project. She has written activities for GCSE
and A-level to encourage the use of ICT in mathematics and has worked as
a consultant on projects for the Mathematical Association, the QCDA and
the NCETM. She is now an independent education consultant. She has a
BSc degree in mathematics from Hull and an MA in Mathematics Education from Chichester.
Luc Trouche is full professor and head of the ICT and Education department in the French National Institute for Pedagogical Research (INRP).
His ield of research concerns the interactions between teachers’ development and resources development. His interest in resources started with the
didactical study of the conditions of ICT integration in mathematics classes,
the resources design and teachers’ training required by this integration. It
led him then, in a joint work with Ghislaine Gueudet, to consider all the
resources intervening in the teacher’s activity. They introduced an approach
for the study of mathematics teachers’ documentation work. They still work
on the development of this approach, and simultaneously implement it in
different research projects.
Pat Woolner is a research associate in the Research Centre for Learning and
Teaching at Newcastle University, UK. Formerly a secondary school mathematics teacher, she has carried out research into forms of representation in
learning and teaching mathmatics. Other research in which she has been
involved has included investigations of the school learning environment
and evaluations of a range of school-based learning innovations. Her current role also involves supporting practising teachers from primary, secondary and further education in action research projects.
David Wright is programme leader for secondary mathematics initial
teacher education at Newcastle University. He taught in secondary schools
and further education for 15 years before joining the British Educational
Communications and Technology Agency (Becta) as subject oficer for
mathematics. He was also co-editor of Micromath, a journal of the Association of Teachers of Mathematics. He is particularly interested in the transformative potential of ICT for mathematics education when integrated into
the mathematics classroom through the use of connected portable technology to form an interactive social space for doing mathematics.
Series Editor’s Foreword
This is a book about innovation in teaching mathematics using digital technologies, and takes an innovative approach in presenting a range of perspectives, taken from national and international research, to explore key
questions about teaching and learning in mathematics.
In this exciting collection of voices, Oldknow and Knights have scaffolded
a conversation between well known and respected international writers and
researchers in the ield, in ways which allow readers opportunities not only
to engage with the chapters in conventional ways, but also invite the reader
through skilful questions provided in the introduction to each section, to
be a third party in discussions between authors, as they themselves offer differing views on such exciting areas as mathematics and neuroscience, intercultural constructions of mathematics teaching, and the possibilities of
home-school enrichment through digital technologies.
The scope of this volume is comprehensive. The irst section, Where are we
now? offers a fascinating set of accounts which present an international
overview of the current and future possibilities of mathematics and technology: learning from other countries is a hugely valuable way of developing
our own self awareness, and the developing areas presented there are a
valuable contribution to pointing up how technology has impacted on
teaching and learning internationally. The next section, What does research
tell us? uses research to deepen our understanding of where technology
enhanced mathematics teaching impacts on student learning; the well
known scholars reporting their research here allow us to see some of the
cutting edge thinking which underpins development; this section is cleverly
balanced with three further sections focusing on practical use of ICT in classrooms, including the intriguing Pizza Problem, and of examples of teaching and learning in mathematics through a series of case studies which tell us
about real classroom uses, and with real classroom thinking thoughtfully
explored. The possibility of technology ‘minding the gap’ between school
and home is explored through the uses of personal portable technology
whilst the pedagogy of digital technology in mathematics is addressed through
three chapters which are tied together through John Mason’s notion of
engagement through manipulatives.
xx
Series Editor’s Foreword
Mathematics is not simply presented as a single, timetabled subject,
though. Its wider role in developing other subject areas, including sports and
leisure, physics and the wider role of STEM is addressed through a selection
of accounts which demonstrate the centrality of mathematics to knowledge
itself. The holistic approach to thinking about mathematics and digital
technology these sections offer is supported by a inal section which considers the role of professional development in bringing about the types of practices
explored in this book through grounded guidance on teacher education.
Oldknow and Knights’ vision for this volume in inviting critical engagement with, and development of, new practice within the ield of mathematics and digital technologies through the presentation of a series of linked,
focused and thought provoking chapters is itself stimulating. I am delighted
to be able to include this book in the series on teaching with digital technologies, and my thanks go to both Adrian Oldknow and Carol Knights for
this excellent volume.
Sue Brindley
Acknowledgements
The editors would like to express their gratitude to all of the contributing
authors, without whom this book would not have been possible.
Thanks also go to the following individuals, companies and organizations
who have granted permission to use screen shots from software, photographs and other images: Doug Brown, CabriLog, Jen-Chung Chuan, Data
Studio, Doyle Davis, Vitor Duarte Teodoro, Bryan Dye, MyMaths, Chris
Olley, Matt Pauling, TDA, T-media, Texas Instruments, Kingsley Webb,
Vernier, Video Point and Phillip Yorke.
Thank you to all the staff at Continuum who worked with us on this
book.
Finally, thanks to colleagues Afzal Ahmed, Alison Clark-Wilson and Anne
Harvey at the University of Chichester, and also Linda Tetlow and Ron Taylor for their various forms of support and advice.
Introduction
Digital technologies – especially portable ones – are universal and affect all
walks of life. They allow people to communicate anywhere, anytime; to take
photographs and movies; to record and play music and ilms; to play games;
to gather information via the internet; to ind out where they are and how
to get to where they want to be; to compose, send and print documents; to
keep their inances in order, and so on. Schools, as with all organizations,
rely heavily on the technology for their administrative functions – and most
teachers have received training in how to use common elements (internet,
e-mail, word-processing, spreadsheets, presentation and display software,
learning platforms etc.) to improve their eficiency as teachers. The big
challenge to education over recent years has been how to integrate digital
technologies into the teaching and learning of subjects to the beneit of all.
This is clearly not a challenge which can be met by a “one-size its all” solution, and so this series of books from Continuum comes at a very important
time when many learning communities are reviewing their approaches to
education.
In mathematics education we have seen a radical change in the range of
uses of digital technologies to support teachers in the classroom, and to enable
students to access school work from home. In the United Kingdom most secondary school (students aged 11–19) mathematics teachers have ready access
to computers (usually laptops), projectors and interactive white-boards. All
schools now have their own websites and learning platforms from which teachers, students and parents can access information about the timetable, curriculum, examinations, careers etc. as well as exercises, homework and so on.
There is also usually support for messages between students and teachers.
Very recently we have seen a number of educational ‘ultra-mobile personal computer’ devices being developed speciically for student use –
robust, lightweight, wireless, long-lasting batteries, powerful and cheap.
These include MIT’s OneLaptopPerChild (OLPC), Intel’s Classmate, and
now an Indian educational tablet PC for $35. Very soon we can expect to
see something resembling the current Apple i-Pad in the hands of learners
all over the world. So we need to prepare for a new era in which students do
Introduction
xxiii
not just have access to an electronic calculator, but the potential to run
applications which can support all forms of mathematical and scientiic
computation, as well as to program their own.
So, if we are to make best use of the potential of such digital technologies
to radically improve teaching and learning mathematics, we need to take
stock of what we know now, what we have seen to work, what we would like
to see tried as well as how to introduce, support and sustain the innovations
required. There is also an added political imperative in many nations now
for schools to place greater emphasis on the STEM subjects (Science, Technology, Engineering and Mathematics) to ensure more school-leavers head
either for Higher Education courses in these disciplines or directly for
employment in which these are key aspects. So, like it or not, we are likely,
as mathematics educators, to be put under increasing pressure to provide
more relevant skills for the national economy.
This book has given us the opportunity to ask experts from around the
world to share their experiences and views. These are organized under the
following headings.
‘Part 1: Where Are We Now?’ reviews the current state of play in education with digital technologies in United States, France and the United Kingdom, together with a review of the underlying neuroscience.
‘Part 2: What Does Research Tell Us?’ draws messages and lessons from
some major international projects.
‘Part 3: Key Pedagogical Issues in Embedding ICT in Teaching and Learning Mathematics’ invites leading educational experts to explore in depth
some facets of the impact of digital technologies on learning mathematics.
‘Part 4: Description of a Range of Important ICT Tools’ identiies important features for mathematics education in the developing technologies.
‘Part 5: Practical Ideas of ICT to Enhance Teaching and Learning’ highlights examples of interesting recent educational developments with the
technology.
‘Part 6: ICT Supporting Cross-curricular Work with Mathematics’ uses
examples from physics, engineering, technology and sports to show how
digital tools make data capture and modelling more accessible and relevant, and hence support a joined-up curriculum.
‘Part 7: Case Studies of Teachers Engaging with ICT’ asks classroom
teachers to share their experience, relections and observations of classroom innovation with digital technologies.
‘Part 8: Implications for Professional Development’ addresses the important issues arising from the need to introduce, support and sustain educational innovations to a wider teaching workforce.
xxiv
Introduction
This is an exciting and challenging period in education at all levels.
Despite current economic dificulties, there are many factors which can
support the harnessing of the potential of digital technologies to make radical improvements in teaching and learning mathematics. We hope that the
sound experience, advice and comments of our authors will make a positive
contribution to realizing that potential.
Adrian Oldknow and Carol Knights
Part One
Where Are We Now?
In this section we have contributions from France, the United Kingdom
and the United States reviewing the extent to which digital technologies
have become embedded in their respective educational systems, and what
trends are now emerging. We have not attempted to get a systematic international survey as it is impossible to discount factors such as – the different
attitudes shown by different cultures towards education and mathematics,
how centralized the political system is, how schools are managed, what
objectives the educational process is seen to serve, and so on. What does
seem apparent is that the digital divide between teachers who have access
to Information and Communications Technology (ICT) to support their
role as a teacher and those who don’t has undergone a rapid change. This
has occurred through access to devices such as broadband, the internet,
portable computers, digital projectors, interactive whiteboards and virtual
learning environments. We can see that teacher groups are developing
curriculum resources which are being put into widespread use through
digital distribution – even if the result is just a printed worksheet! What is
emerging now, with the introduction of ever more portable, powerful and
affordable student devices, is the challenge to integrate these into mathematical learning, and assessment. With regard to widespread students’
own use of technology as a research tool, an analysis tool and/or a
presentation tool, it looks, in the words of Lewis Carroll, like a case of ‘jam
to-morrow’. But we can see some very interesting approaches developing,
and we can hope that, unlike the White Queen’s interpretation, ‘to-morrow’
may not be long in coming. Which is why it is also helpful to include a
contribution reviewing what we know about how students learn.
Chapter 1
The Neuroscience of Connections,
Generalizations, Visualizations and Meaning
Edward D. Laughbaum
Department of Mathematics, The Ohio State University, US
Introduction
Did you ever wonder whether teachers consider basic brain function of
students when designing lessons or lectures? That is, do we ever think about
teaching to be in concert with how the brain functions? Have we considered capitalizing on basic brain function that will improve understanding
and long-term memory with recall? Are we aware that the brain requires
neural connections to process understanding, long-term memory, and
recall? Do we know whether the brain commonly generalizes through
reasoning or through pattern recognition? Do we know why it is important
for students to generalize a pattern on their own? Have we thought about
whether using visualizations to conirm mathematical processes and concepts holds the same understanding/memory value as does using visualizations to teach processes and concepts? If we knew the answers to these
questions, would we change the way we teach? Would textbooks change to
facilitate such teaching? Would standards documents focus on teaching
instead of providing topic lists?
There are a considerable number of basic brain operating functions that
can be applied to the ield of mathematics education, but in this chapter,
the author will only reference research in brain function related to connections, pattern recognition, visualizations and meaning. Some may question
the validity of a proposal to change education to be in concert with basic
brain function since the brain is so complex. It is complex, but the proposal to change teaching is based on common neural function (no matter
how complex on a cellular and molecular level), and the implementation is
4
Mathematics Education with Digital Technology
somewhat simple. Breakthrough ideas often emerge by applying ideas from
one ield to another.
Connections in Mathematics = Associations in the Brain
Neural associations are the connections among neural networks that the
brain creates automatically and instantaneously when it learns something new.
Donald Hebb discovered the creation of associations over 50 years ago. We
commonly describe his discovery as ‘Neurons that ire together, wire
together’. For example, suppose you want to create neural associations
among the numeric, graphic and symbolic representations of a function. It
is extremely simple to do. Graph a function on a graphing calculator (or
computer) and use trace (with expression turned on) to trace on the graph,
or use a graphic/numeric split screen. Both of these options present the
brain with the simultaneous representations of a function causing the
neural networks for the three representations to be associated (connected).
But why is this important?
Current research shows that ‘ . . . the lower left part of the frontal lobe
works especially hard when people elaborate on incoming information by
associating it with what they already know’ (Schacter, 2001, p. 27). But there
are issues when we facilitate associations in maths education. ‘This echo
[neurons continuing to ire after the stimulus has stopped] of activity allows
the brain to make creative associations as seemingly unrelated sensations
and ideas overlap’ (Lehrer, 2009, p. 130). Do we really want students connecting addition of polynomials, for example, to concepts that are unique
to each student? Doesn’t it make more sense for the teacher to facilitate the
creation of appropriate associations that can be used later in the teaching/
learning process? It is possible. ‘Being able to hold more information in the
prefrontal cortex, and being able to hold on to the information longer,
means that the brain cells are better able to form useful associations’
(Lehrer, 2009, p. 131). Outside of education, it is common to lead an audience to connections of choice. For example, ‘Advertisers don’t wait for you
to develop your own associations. They go ahead and program you with
theirs through television [like a cool-looking person smoking, or females
showing interest in guys in cars]’ (Brodie, 1996, p. 25). Of course, what
politician has not used the word ‘trust’ on the same TV screen with their
name? Recall that it is rather simple to create associations. Simultaneously
present the brain with the concepts/procedures you want connected. But
again, why are connections important?
Neuroscience and Mathematics
5
Teachers must create connections to improve the memory of the mathematics taught. ‘Memory recall almost always follows a pathway of associations. One [neural] pattern evokes the next pattern, which evokes the
next pattern, and so on’ (Hawkins, 2004, p. 71). In teaching factoring of
polynomials, one would connect the new maths being taught to the previously taught concept of zeros of a function. Using hand-held or computer
technology, it is relatively simple to ind zeros of polynomial functions
expressed as rational numbers. By connecting the two processes, when students are asked to factor a quadratic polynomial at a later time, they are
likely to think of zeros irst (because of the visual methods used in teaching), followed by the factoring process.
The most important property [of auto-associative memory] is that you
don’t have to have the entire pattern you want to retrieve in order to
retrieve it. . . . The auto-associative memory can retrieve the correct pattern, . . . even though you start with a messy version of it. (Hawkins, 2004,
p. 30)
So we have good odds that connected concepts will be recallable.
Teachers must also create connections to enhance the understanding of
the concept or procedure being taught. That is, ‘We understand something
new by relating it to something we’ve known or experienced in the past’
(Restak, 2006, p. 164). The word understanding seems to hold value in the
minds of many educators. For example from Keith Devlin,
How many children leave school with good grades in mathematics but no
understanding of what they are doing? If only they understood what was
going on, they would never forget how to do it. Without such understanding, however, few can remember such a complicated procedure for long
once the inal exam has ended. . . . What sets them [those who ‘get it’]
apart from the many people who never seem to ‘get it’ is not that they
have memorized the rules better. Rather, they understand those rules
(2000, pp. 67–68)
We will ind that visualizations and pattern recognition also contribute to
the understanding of mathematical procedures and concepts. They are
discussed below.
Mathematical connections typically come in two forms. The irst and
most important connection is to previously taught mathematics, but also,
‘New information becomes more memorable if we “tag” it with an emotion
6
Mathematics Education with Digital Technology
[like a familiar real-world context]’ (Restak, 2006, p. 164). So we also need
to connect new maths concepts to contexts that are familiar (evoke an emotional response) to students. For example, when teaching (not applying) the
concept of the behavior of zero(s) of a function by modelling the amount
of luid remaining in an I.V. drip bag, we ‘tag’ it with the real-world meaning of the zero – the bag is empty. That is, the nurse must take action at the
zero. If the nurse does not replace the bag, the patient may die. If the
patient dies, the zero becomes important to the prescribing doctor and
several lawyers, and so on. The result of tagging a mathematical concept or
process with an emotional connection is improved memory. It turns out
that the more connections to a mathematical concept/procedure, the more
likely the correct recall. That is:
In general, how well new information is stored in long-term memory
depends very much on depth of processing, . . . A semantic level of processing, which is directed at the meaning aspects of events, produces
substantially better memory for events than a structural or surface level of
processing. (Thompson and Madigan, 2005, p. 33)
Pattern Building to Pattern Generalizing
Using pattern building as a tool to help students generalize a pattern, like for
example the irst law of exponents, has a stained history. The pervasive view
is that mathematics is understood through ‘reasoning’, and this is the standard to which mathematicians typically hold. This may be a noble thought,
but it turns out that reasoning is NOT the brain’s dominate mode of operation. Gerald Edelman is a Nobel Laureate in medicine and makes an interesting point, ‘human brains operate fundamentally in terms of pattern
recognition rather than logic [reasoning]. It [pattern recognition] is enormously powerful, but because of the need for range; it carries with it a loss of
speciicity’ (Edelman, 2006, pp. 83, 103). Of course, this loss of speciicity is
what concerns educators. In mathematics, we may want students to generalize the exact concept/procedure of our choice, and not other options that
are open to the student’s brain. Yet given the evidence that the primary mode
of operation of the brain is pattern generalizing; shouldn’t we capitalize on
this? Might it improve understanding and memory? A good option for implementing pattern building is to use guided discovery activities because ‘ . . .
the use of controlled scientiic observation enormously enhances the speciicity and generality of these interactions’ (Edelman, 2006, p. 104). Based on
Neuroscience and Mathematics
7
the author’s experience, successful guided discovery activities are short and
lead directly to the desired mathematical generalization. The average brain
will generalize on the third iteration. As you might expect, some students will
generalize after the irst or second – especially after using the process in class
for a while, so one needs to think through the guided discovery activity questions that lead students to generalize. However, ‘After selection occurs . . .
reinements can take place with increasing speciicity. This is the case in
those situations where logic or mathematics can be applied’ (Edelman, 2006,
p. 83). Thus, it seems that guided discovery is a good choice.
There is more to the idea of tapping into common brain function through
pattern building. We may not know at what point, if any, that the brain creates a long-term memory of a mathematical procedure through practice.
But, in pattern building, ‘If the patterns are related in such a way that the
[brain] region can learn to predict what pattern will occur next, the cortical region forms a persistent representation, or memory, for the sequence’
(Hawkins, 2004, 128, emphasis introduced). It is crucial that teachers not
‘tell’ students the desired generalization, but teachers must structure the
pattern-building activity that gently leads students to generalize after a reasonable pattern-building activity has been completed. An excellent tool for
knowing what each student has generalized is the TI Navigator. With the
proper use of Navigator, every student must generalize, and not just the
student holding up their hand.
As soon as the student makes the generalized pattern, we know the memory has been created. In addition, the recognition of the pattern by students
activates the neural reward system, ‘ . . . which is consciously experienced as
a feeling of knowing’ (Burton, 2008, p.135, emphasis introduced). This
feeling of knowing promotes the low of the neuro-transmitter dopamine.
‘This system is found in the basal ganglia and the brain stem. The release of
dopamine acts as a reward system, facilitating learning’ (Edelman, 2006,
p. 31). ‘Our brain with its capabilities of pattern recognition, closure, and
illing in, goes, as Jerome Bruner pointed out, beyond the information
given’ (Edelman, 2006, p. 154). The bottom line is that we should facilitate
the brain’s ability to generalize patterns, not just for the mathematics, but
for all of life where generalizing correctly is of utmost importance.
Visualizations
The idea that our vision system navigates through our mathematical thinking may seem unusual, but the fact is that ‘Neuroplasticity, . . . can reshape
8
Mathematics Education with Digital Technology
the brain so that a sensory region performs a sophisticated cognitive function’ (Bagley, 2008, p. 99).
Mathematical reasoning both takes from and gives to the other parts of
the mind. Thanks to graphs, we primates grasp mathematics with our
eyes and our mind’s eye [occipital lobes]. Functions are shapes (linear,
lat, steep, crossing, smooth), and operating is doodling in mental
imagery (rotating, extrapolating, illing, tracing). In return, mathematical thinking offers new ways to understand the world. So, vision was coopted for mathematical thinking, which helps us see [understand] the
world. (Pinker, 1997, pp. 359–60)
Processing mathematics through the visual system suggests that we should
integrate visualizations in our pedagogy. But there is more . . .
Instead of accepting the reasoning above as appropriate, might there be
another rationale for using visualizations? The author suggests at least two
other reasons based on common brain function. ‘Advocates of dual coding
theory argue that people retain information best when it is encoded in
both visual and verbal codes’ (Byrnes, 2001, p. 51). Therefore, we surmise
that using visualizations improves retention of the mathematics taught.
Secondly, we ind that ‘ . . . after studying pictures along with the words,
participants . . . easily reject items that do not contain the distinctive pictorial information they [brains] are seeking’ (Schacter, 2001, p. 103).
Schacter’s research implies that our students may ignore symbolic work if
not accompanied by visualizations. Fortunately, we have hand-held devices
that can quickly produce most of the visualizations needed in school mathematics at the levels of calculus and below. The author’s work with inservice mathematics teachers revealed that most teachers use visualizations
to conirm pencil and paper procedures. Is this pedagogy suficient to produce better recall and reduce rejection?
There is another consideration regarding the use of visualizations, and it
is the timing of its use. ‘Any attempt to reduce transience [memory loss
over time] should try to seize control of what happens in the early moments
of memory formation, when encoding processes powerfully inluence the
fate of the new memory’ (Schacter, 2001, p. 34). In addition ‘ . . . because
we have visual, novelty-loving brains, we’re entranced by electronic media’
(Ackerman, 2004, p. 157). Therefore, in creating a better memory of the
mathematics we are teaching, use a hand-held (or other) electronic device
at the beginning of a lesson. This draws attention to the mathematics. Once
Neuroscience and Mathematics
9
we have student’s attention, the visualization will be the key to positively
inluencing the very existence of the memory.
Meaning
Mathematics educators would probably argue that we should provide meaning to the rather abstract mathematical concepts we teach. The reasons for
adding meaning to the mathematics we teach likely varies from teacher to
teacher. The methods for attaching meaning may vary as well. From a
neuroscientist view, Steven Pinker offers an idea: ‘The human mind, we see,
is not equipped with an evolutionarily frivolous faculty for doing Western
science, mathematics, chess, or other diversions. . . . The mind couches
abstract concepts in concrete terms’ (1997, pp. 352–53). If the brain
attempts to understand abstract ideas by interpreting them in concrete
terms, this suggests that teachers can help the brain understand abstractions by providing meaning through real-world contexts that make sense to
our students. A real-world context should be simple, familiar (or easily
explainable), and lead directly to the mathematics we are teaching. Supplemental to enhancing understanding, real-world context will add the emotional connection (tag) that will improve memory.
However, there is more to the idea of adding meaning through real-world
contexts.
When a child has a personal stake in the task, he can reason about that
issue at a higher level than other issues where there isn’t the personal
stake. . . . These emotional stakes enable us all to understand certain concepts more quickly. (Greenspan and Shanker, 2004, pp. 241–42)
In the process of adding meaning through familiar contextual situations,
we beneit from our students being able to function at a higher cognitive
level and understand concepts/procedures more quickly. The simple and
familiar context Greenspan and Shanker used in one study was to manipulate
candies in the process of teaching addition. The point is that the emotional,
or personal stakes, can be extremely simple. Further, the researchers suggest that the contextual situation be used to teach mathematics. There is no
mention of using applications, something we use after the mathematics has
been taught.
10
Mathematics Education with Digital Technology
Finally, and repeated for emphasis, we ind: ‘A semantic level of processing, which is directed at the meaning aspects of events, produces substantially better memory for events than a structural or surface level of
processing’ (Thompson and Madigan, 2005, p. 33).
Conclusion
Neuroscience has other research results on basic brain function that we can
apply to education. Memory considerations, an enriched teaching/learning
environment, attention, and accessing unconscious processing come to
mind. The issue is whether thinking of teaching as being about ‘explaining’
a list of topics followed by practice can be the paradigm to facilitate a brainbased pedagogy. Technology (hand-held and other) plays a signiicant role
in facilitating the use of connections, pattern generalization, visualizations,
and meaning.
The author proposes that algebra be taught with function as an underlying theme, which is taught with the daily use of graphing technology and
TI-Navigator. For more information about the use of function as a central
theme, see articles posted at www.math.ohio-state.edu/~elaughba/.
References
Ackerman, D. (2004). An Alchemy of Mind: The Marvel and Mystery of the Brain.
New York: Scribner.
Bagley, S. (2008). Train Your Mind: Change Your Brain. New York: Ballantine Books.
Brodie, R. (1996). Virus of the Mind: The New Science of the Meme. Carlsbad, CA: Hay
House.
Burton, R. A. (2008). On Being Certain: Believing You Are Right Even When You’re Not.
New York: St Martin’s Press.
Byrnes, J. P., (2001). Minds, Brains and Learning: Understanding the Psychological and
Educational Relevance of Neuroscientiic Research. New York: The Guilford Press..
Devlin, K. (2000). The Math Gene: How Mathematical Thinking Evolved and Why Numbers
Are Like Gossip. New York: Basic Books.
Edelman, G. M. (2006). Second Nature: Brain Science and Human Knowledge. New Haven,
CT: Yale University Press.
Greenspan, S. I. and Shanker, S. G. (2004). The First Idea: How Symbols, Language, and
Intelligence Evolved from our Primate Ancestors to Modern Humans. Cambridge, MA:
Da Capo Press.
Hawkins, J. (2004). On Intelligence. New York: Times Books.
Lehrer, J. (2009). How We Decide. New York: Houghton Miflin Harcourt.
Neuroscience and Mathematics
11
Pinker, S. (1997). How the Mind Works. New York: W. W. Norton & Company.
Restak, R. (2006). The Naked Brain. New York: Three Rivers Press.
Schacter, D. L. (2001). The Seven Sins of Memory: How the Mind Forgets and Remembers.
Boston, MA: Houghton Miflin Company.
Thompson, R. F. and Madigan, S. A. (2005). Memory. Washington, DC: Joseph Henry
Press.
Chapter 2
ICT in the United States: Where We Are
Today and a Possibility for Tomorrow
Gail Burrill
Michigan State University, US
Every school mathematics program should provide students and teachers with
access to tools of instructional technology, including appropriate calculators, computers with mathematical software, Internet connectivity, handheld data-collection
devices, and sensing probes.
(NCTM, 2003)
The Present
ITC in Schools
Technology in a variety of forms is becoming increasing common in classrooms in the United States, as it is in much of the rest of the world. In fall
2005, nearly 100 per cent of public schools in the United States had access
to the internet, compared with 35 per cent in 1994; 94 per cent of public
school instructional rooms had internet access, with little difference by
school characteristics (Wells and Lewis, 2006). Interactive white boards are
becoming more and more prevalent in schools; in 2007, 21 per cent of the
classrooms were equipped with them, 35 per cent in 2009, and the prediction is that by 2011 nearly 50 per cent of US classrooms will have interactive
white boards (ICT Products Market Report, 2008). Another type of technology, classroom response systems or ‘clickers’, was used in 16 per cent of
the classrooms (Texas Instruments Education Technology, 2009).
Online courses are becoming more common, particularly for students
in small schools primarily as a way of reaching underserved students, not
as a preferable alternative to classroom instruction. Recently, however,
policy-level calls are looking for online instruction as a cost-eficiency
strategy. As of 2008, 25 states have or support statewide virtual schools,
usually for middle or high school grade spans; four states offer elementary
13
ICT in the United States
programmes. An increasing number of states (currently 27) offer computerized state assessments to at least some students (Bausell, 2008). The state
of Maine has programmes in place to provide every student with a laptop or
access to equivalent technology, but how this is relected in classrooms, particularly mathematics classrooms, has not been documented.
Calculators/Computers
Despite the advances in technology as a communication and interaction
medium, the hand-held calculator is still the most universally adopted technology in mathematics classrooms. About 76 per cent of the US 4th grade
students have access to a four-function calculator, a number that has been
relatively constant over the years, with about 6 per cent having a graphing
calculator (NCES, 2008). The use of graphing technology for students in
grade 8 (about age 14) shows a slight positive trend (Table 2.1).
The frequency of calculator use at the secondary level varies according to
the type of course, with students in algebra and higher courses more likely
to use graphing and other calculators than students in pre-algebra or regular courses (Braswell et al., 2001). In 2005 (NCES, 2008), 62 per cent of
grade 12 students reported using a calculator for homework every day or
almost every day with another 16 per cent using the calculator two or three
times a week; 64 per cent of the students usually used a graphing calculator.
About 43 per cent of the students used a graphing calculator outside of
school. Less than 25 per cent of students in grade 8 and 20 per cent of the
students in grade 12 reported doing anything with computers; this includes
the few who reported using computer software as a resource for extra
support for learning (NCES, 2008).
Table 2.1 Percents of Eighth-grade Students in NAEP Studies
Reporting Use of Graphing Calculator in Mathematics Class
Year
Always
Sometimes/
not often
Never
Use of graphing calculators in math class
2005
2007
19
21
27
25
55
49
Use of graphing calculators on tests
2000
2007
23
20
45
54
32
26
Braswell et al. 2001; NCES 2003; NCES 2008
14
Mathematics Education with Digital Technology
Nearly every mainstream textbook series at the high school level includes
graphing calculator activities, and ive of the series include TI-Nspire™
activities, although in most of these the applications are not in fact necessary for the course (Senk et al., 2004). According to a scrutiny of state assessment administration guides, graphing calculators are recommended or
allowed in 40 states and required by 7 states for end of course or high school
exit examinations.
At the post-secondary level, according to Dossey et al. (2008) the number
of calculus sections at 2-year post-secondary institutions using graphing
calculators had increased from 44 per cent of the sections in 1995 to over
75 per cent in 2005, in particular for non-mainstream calculus. At 4-year
institutions usage also increased from about 30 per cent of the sections in
1995 to about 50 per cent in 2005. The one downward trend over that same
period is that use of computers in mainstream calculus sections for both
2- and 4-year institutions decreased from 35 per cent and 31 per cent respectively to 20 per cent.
Mathematics Software
Currently there are many examples of technology applications in mathematics teaching. The No Child Left Behind Act (2002) of the US Congress
requires states that want to receive federal funding to develop assessments
in basic skills to be given to all students in certain grades. Motivated by this
law, schools in the United States are struggling to have their students
become ‘proicient or better’ on their state designed mathematics assessments. Strategies to support those who fail often involve interactive, selfpaced software that provide drill in arithmetic skills or mathematical
procedures. Many of the programmes are supplementary to the curriculum
and require students to spend time during the day on mathematics in addition to their regular mathematics classes but are often implemented with
no connection to the school programme or to the mathematics that is being
taught in the regular class sessions. According to a US Department of Education analysis, only one programme of this nature, the I CAN Learn® Education System, which supports students aged 11–14 in learning the fundamentals
of mathematics and algebra, has been shown to be somewhat effective in
raising student achievement (What Works Clearinghouse, 2009).
The use of software speciically for teaching and learning as a part of mathematics instruction has remained relatively constant with about 70 per cent of
high school teachers reporting no use at all. The Geometer’s Sketchpad, the most
ICT in the United States
15
commonly used dynamic geometry software in the United States, was used by
approximately 7 per cent of the teachers (Texas Instruments Education Technology, 2009) and Fathom, software for learning statistics, is estimated to be
used by about 6000 secondary teachers or about 1 per cent of the teachers
(Finzer, 2009). Secondary teachers are also beginning to use software such as
GeoGebra, and sessions on how to do so are becoming standard at mathematics conferences, but the extent of use is dificult to track. None of these data
indicate whether and how often teachers use the software, however.
Classroom Instruction
Overall, the research on what teachers actually do with technology and on
its impact on student learning is limited. A state-by-state report on innovation, Leaders and Laggards (2009), found little data relating to states’ use of
technology to rethink the delivery of education or improve outcomes and
concluded that, ‘Educators often give little thought to how technology
might modernize education delivery and thus improve teaching and learning. Schools, for example, frequently purchase computers without clear
learning goals – and eventually let them languish at the back of classrooms.’
(p. 46). Smith et al. (2005) used the words ‘boon or bandwagon’ in discussing research on the use of interactive white boards. They concluded that
although teachers and students appeared strongly in favour of them, there
is insuficient evidence to identify any impact on student learning and
achievement. An indication of their popularity, however, is that over 400
teachers lined up an hour early for a session on interactive technology at
the 2009 Annual Meeting of the National Council of Teachers of Mathematics; the presentation focused primarily on how to use the technology, not
on the mathematics students could learn. This is not unusual in the history
of research on technology and learning that typically shows no signiicant
difference due to the mere introduction of technology. The most recent
examples include the large IES-funded technology study (Dynarski et al.,
2007) and recent studies of one laptop per child and interactive whiteboards. All of this research implies that it is not a reasonable expectation
that introducing technology, by itself, will impact learning substantially.
Leatham and Peterson (2005) argue, ‘Much of what we know about the
use of technology in the teaching and learning of mathematics is anecdotal
and might be referred to as “possibility” research.’ Some research on the
use of hand-held technology and on dynamic software does suggest, however,
that such tools can have a positive inluence on what and how students
16
Mathematics Education with Digital Technology
learn mathematics. (See e.g., Burrill, et al., 2002; Ellington, 2003, 2006;
Graham and Thomas, 2000; Schwarz and Hershkowitz, 1999; Hollar and
Norwood, 1999 related to graphing calculators; Jones, 2002; Hollebrands
et al., 2008 on dynamic geometry software). The existing research makes
clear that what is important is how teachers use the technology. Some largescale studies are currently being conducted (e.g., Owens et al., 2008) but
given the magnitude of the research needed, these are few and scattered in
terms of approaches and seem to be neither coherent nor cumulative.
Several recent trends, however, seem promising as ways to enhance learning of core mathematical concepts. The following section describes some
new thinking about the use of dynamic interactive software in an appletbased environment.
New Opportunities
Despite the lack of good information about the impact of technology on
classrooms, the technology itself continues to advance at a phenomenal
rate. Typically, as described above in terms of textbooks, the use of handheld devices and computers as part of classroom instruction in the past has
primarily been as a toolbox to perform calculations and carry out procedures and
their role has not been integral to the lesson; concepts are developed by the
teacher with technology ‘added on’ for students to check solutions or apply
those concepts. Such uses of the technology are important, and have
enabled more students to engage in high quality mathematics and to solve
problems that they could not have done without it. Dynamic interactive
technology, however, has opened up new opportunities to consider how
technology can be used from another perspective, as a tool for learning by
enabling the creation of ‘environments’ in which students can play with a
mathematical idea in a variety of ways but where the opportunity to go
astray, both mathematically and operationally, is limited.
By imposing constraints on what is possible, teachers and students
actually have more freedom to explore central mathematical concepts in
deeper ways. Such environments are similar to using applets, (see e.g., the
Rice University Virtual Lab in Statistics at http://onlinestatbook.com/rvls.
html ; SimCalc at www.kaputcenter.umassd.edu/products/software/ ; or the
Freudenthal Institute website at www.i.uu.nl/wisweb/en/) and have certain
characteristics:
z
Little knowledge about the operation of the hand-held or computer is
required to use the set of applets.
ICT in the United States
z
z
z
z
z
17
The fundamental idea is simple and straightforward. The development
has both mathematical idelity (is mathematically sound and accurate)
and pedagogical idelity (does not present obstacles that obscure or hide
critical features).
The design is based on an action/consequence/relection principle,
where students take an action on a mathematical object, immediately see
the consequences, and relect on the implications of these consequences
for a particular mathematical objective. (Dick et al., 2007)
The interaction is typically driven by one object such as a point, slider,
shape or graph and is not menu driven.
The action/consequence activity is usually composed of two or three
carefully sequenced applets designed to have students investigate a core
mathematical concept.
The applets are intended to support the existing curriculum and can be
packaged or sequence to complement a standard chapter or unit of
study.
The following examples illustrate how ‘action/consequence’ applets might
be used to develop understanding of fundamental mathematical concepts.
The activities stem from a careful examination of high stakes assessments,
many developed by each state to comply with No Child Left Behind, usually
end of course or school leaving requirements necessary to receive a secondary diploma. From item analyses of these assessments across states (Burrill
and Dick, 2006), we were able to identify content topics on which students
consistently had low achievement scores. Based on this information and on
research about student learning, action/consequence experiences can be
designed to help students better understand the core concepts that had
emerged as problematic.
As an illustration, the assessment analyses and the research (e.g., Kuth
et al., 2007) suggest that students have trouble with the concept of the variable. Students also have poor achievement scores with tasks that involve
reasoning about mathematical concepts and with solving systems of equations. The following examples describe action consequence documents
that might be used to help develop student understanding of the mathematics involved. Figure 2.1 shows an action/consequence document where
the value of an expression is displayed as students move a point on a number line with integer coordinates. As students move the point, they can
investigate a variety of questions while developing a sense of variable: How
does the output change as the value of x changes? When, if ever, will the
output be divisible by 4? Will the output be zero? Why or why not? Can you
get the same output for different values of x?
18
Mathematics Education with Digital Technology
Figure 2.1
An Expression and a Number Line
Figure 2.2
Two Expressions and a Number Line
Dragging a point as shown in Figure 2.2 allows students to investigate the
difference between expressions and equations, laying the foundation for
thinking about an equation as the equality of two expressions, and building on their developing sense of a solution for a more general linear equation in one variable. Probing questions push students to look at these
relationships and to reason about the variables, the coeficients and the
output.
‘What is a Solution?’ (Figure 2.3) involves an investigation of a solution
to a linear equation in two variables. In the irst activity, students drag a
point whose coordinates satisfy a ‘current’ equation until the current equation matches the ‘goal’ equation, then mark that point. Questions can be
posed to drive student thinking about how to extend the concept of solution
ICT in the United States
19
Figure 2.3 What Is a Solution
Figure 2.4
Balanced Systems
to a linear equation in two variables. In examining strategies for inding
more points that satisfy the target equation, students can also make a connection to slope. Balanced Systems (Figure 2.4) connects to the earlier
documents and allows students to experiment with a system of equations by
inding the ‘balance point’ for both equations at the same time. The next
igures use the balance scales to investigate dependent and inconsistent
systems.
20
Mathematics Education with Digital Technology
As students make conjectures about strategies for balancing both the equations at the same time, they can develop a sense of how the two equations
are interacting – and with the right questions, make connections to the
graphs of those equations and what the intersection would mean.
Conclusion
Technology has many faces in mathematics classrooms. One of the newest
involves dynamic interactive software activities, such as those described in
this chapter, for either a hand-held or a computer that engages students in
thinking about concepts across mathematical domains, using the notion
that allowing students to repeatedly take a mathematical action, observe
the consequences and relect on the mathematical implications improves
understanding. Currently some activities such as those described above are
being developed as a part of a freeware offering called Math Nspired (2009)
from Texas Instruments Education Technology. While such activities raise
questions for mathematics education research, they seem like the next step
in taking advantage of technology to scaffold a better understanding of
central mathematical concepts for students.
References
Bausell, C. V. (2008). ‘Tracking U. S. trends in Technology Counts 2008 STEM’.
Education Week, 27 (30), 40–41.
Braswell, J., Lutkus, A., Grigg, W., Santapau, S., Tay-Lim, B. and Johnson, M. (2001).
The Nation’s Report Card: Mathematics 2000. Washington DC: National Center for
Education Statistics.
Burrill, G., Allison, J., Breaux, G., Kastberg, S. E., Leatham, K. and Sanchez, W. B.
(2002). Handheld Graphing Technology in Secondary Mathematics: Research Findings
and Implications for Classroom Practice. Dallas, TX: Texas Instruments, Inc.
Burrill, G. and Dick, T. (2006). Presentation at National Council of Supervisors of
Mathematics Annual Meeting, Atlanta, GA.
Dick, T., Burrill, G. and Brady Gill, L. (2007). ‘New technologies offer new ways to
engage students’. NCSM Newsletter, 38 (1), 19–21.
Dossey, J. and Halvorsen, K. and McCrone, S. (2008). Mathematics Education in the
United States 2008: A Capsule Summary Fact Book. Reston, VA: National Council of
Teachers of Mathematics.
Dynarski, M., Agodini, R., Heaviside, S., Novak, T., Carey, N., Campuzano, L., Sheila
Heaviside, S., Novak, T., Carey, N., Campuzano, L., Means, B., Murphy, R.,
Penuel, W., Javitz, H., Emery, D. and Sussex, W. (2007). ‘Effectiveness of reading
and mathematics software products: Findings from the irst student cohort’.
(Publication No. 2007–4005). Retrieved 18 November 2007, from the Institute of
ICT in the United States
21
Education Sciences, U.S. Department of Education Website: ies.ed.gov/ncee/
pdf/20074005.pdf
Ellington, A. J. (2003). ‘A meta-analysis of the effects of calculators on students’
achievement and attitude levels in precollege mathematics classes’. Journal of
Research in Mathematics Education. 34 (5), 433–64.
—(2006). ‘The effects of non-CAS graphing calculators on student achievement
and attitude levels in mathematics: A meta-analysis’. School Science and Mathematics. 106 (1), 16–26.
Finzer, W. (2009). Personal correspondence.
Graham, A. T. and Thomas, M. O. J. (2000). ‘Building a versatile understanding of
algebraic variables with a graphic calculator’. Educational Studies in Mathematics,
41 (3), 265–82.
Hollar, J. C. and Norwood, K. (1999). ‘The effects of a graphing-approach intermediate algebra curriculum on students’ understanding of function’. Journal for
Research in Mathematics Education, 30 (2), 220–26.
Hollebrands, K., Laborde, C., and Strässer, R. (2008). ‘Technology and the learning
of geometry at the secondary level’. In Heid, K. and Blume, G. (eds), Research on
Technology and the Teaching and Learning of Mathematics, pp. 155–206. Greenwich,
CT: Information Age.
Interactive Displays / ICT Products Market Report, 2008, Decision Tree Consulting.
Jones, K. (2002). ‘Implications for the classroom: Research on the use of dynamic
software’. Micromath.18 (3), 18–21.
Kuth, E., Alibali, M., Stephens, A. and Asquith, P. (2007). ‘Middle school
mathematics teachers’ knowledge of students’ understanding of core algebraic
concepts: Equal sign and variable’. Mathematical Thinking and Learning, 9 (3),
249–72.
Leaders and Laggards: A State-by-state Report Card on Educational Innovation. (2009).
Center for American Progress, U.S. Chamber of Commerce, and Frederick M.
Hess, director of education policy studies at the American Enterprise Institute.
www.uschamber.com/assets/icw/09reportcard/09_leadersandlaggards.pdf
(accessed on 9 November 2009).
Leatham, K., and Peterson, B. (2005). ‘Research on teaching and learning mathematics with technology: Where do we go from here?’ In Lloyd, G. M., Wilson,
M., Wilkins, J. L. M., and Behm, S. L. (eds) Proceedings of the 27th annual meeting of the North American Chapter of the International Group for the Psychology
of Mathematics Education. Virginia Technology Institute. [CD-ROM]. Eugene,
OR: All Academic.
National Center for Education Statistics (NCES) (2003). Digest of Educational Statistics: 2002. Washington DC: U.S. Department of Education.
National Center for Education Statistics (NCES) (2008). National Assessment of Educational Progress (2005). Data Explorer High School Transcript Study.
National Council of Teachers of Mathematics. (2003). The Use of Technology in the Teaching and Learning of Mathematics. NCTM Position Statement. Reston, VA: Author.
www.nctm.org/uploadedFiles/About_NCTM/Position_Statements/technology.
pdf (accessed on 9 November 2009).
No Child Left Behind Act of 2001. (Pub.L. 107–110, 115 Stat. 1425, enacted 8
January 2002). Washington DC: United States Congress.
22
Mathematics Education with Digital Technology
Owens, D. T., Pape, S. L., Irving, K. E., Sanalan, V., Boscardin, C. K. and Abrahamson,
L. (2008). ‘The connected algebra classroom: A randomized control trial’, Proceedings for Topic Study Group 22, Eleventh International Congress on Mathematics
Education. Monterrey, Mexico, Retrieved 2 July 2009 from tsg.icme11.org/document/
get/249
Schwarz, B. B., and Hershkowitz, R. (1999). ‘Prototypes: Brakes or levers in learning
the function concept? The role of computer tools’. Journal for Research in Mathematics Education, 30, 362–89.
Senk, S., Burrill, G. and Olanoff, D. (2004). ‘Knowledge for teaching algebra: What
can we learn from examining textbooks?’ Paper prepared for the Association of
Mathematics Teacher Educators Annual Meeting, San Diego, CA.
Smith, H., Higgins, S., Wall, K. and Miller, J. (2005). ‘Interactive whiteboards: Boon
or bandwagon? A critical review of the literature’. Journal of Computer Assisted
Learning. Blackwell Publishing Ltd, 21, 91–101
Texas Instruments Education Technology. (2009). Marketing Survey.
Texas Instruments Education Technology. (2009). Math Nspired. www.ti-mathnspired.
com/ (accessed on 9 November 2009).
Wells, J., and Lewis, L. (2006). Internet Access in U.S. Public Schools and Classrooms:
1994–2005 (NCES 2007–020). U.S. Department of Education. Washington, DC:
National Center for Education Statistics.
What Works Clearing House (2009). Institute for Education Sciences. U.S, Department of Education. http://ies.ed.gov/ncee/wwc/ (accessed on 9 November
2009).
Chapter 3
ICT in France: Development of Usages,
Institutional Hesitations and
Research Questions
Luc Trouche and Ghislaine Gueudet
INRP, Lyon, France
Introduction
In France, as in other countries, it is acknowledged that tools evolve faster
than their usage, particularly in school mathematics, despite institutional
pressure (Trouche, 2005). However, evidence of deep changes is appearing,
fostered by the internet and hand-held technologies. For example, teachers
design and share resources on a large scale and innovative assessment
procedures and teacher training devices are promoted by the French education ministry (Mission e-Éduc, 2008). Portraying a comprehensive picture of
such an evolving landscape is dificult; therefore, we present here three
snapshots to give an idea of the main current trends, and consider the development of new theoretical tools required to analyse these new phenomena.
(1)
Collaborative design of online resources: the Sesamath association
A major development in France is the growth of teachers’ online associations,
which enable the design and sharing of teaching resources, in mathematics in
particular. The Sesamath1 association (Montessinos and Kuntz, 2008) has only
around 70 members, almost all of them secondary school teachers, but its
website reports more than 1.3 million hits each month. The objectives of Sesamath are to promote Information and Communications Technology (ICT)
integration, to foster teachers’ collaborative work and to support students’
learning. The resources freely available from the association comprise:
z
an e-exercise module, Mathenpoche, which covers the whole curriculum
from grades 6 to 9 with interactive exercises. Mathenpoche is probably
24
z
z
z
Mathematics Education with Digital Technology
the main reason for Sesamath’s success (Bueno-Ravel and Gueudet, 2009):
its use is very simple, and no similar e-exercises resource exists in
France;
a set of lessons and exepreadsheet (Casenpoche), a dynamic geometry
software (Tracenpoche), srcises in Acrobat Reader document (pdf) or
OpenOfice format (called Mathadoc);
a range of software: a simulation of geometry tools (Instrumenpoche);
online textbooks, with traditional lessons and exercises complemented
by interactive resources, for example, links towards interactive geometry
igures; these textbooks have counterparts on paper (much cheaper
than the ordinary textbooks).
Sesamath was established in 2001, by a group of approximately 15 teachers
who intended to share online resources each of them had designed. They
soon started collectively developing Mathenpoche, which was completed in
2006: subgroups were responsible for particular themes. During this period,
other members joined, new projects emerged; collaborative work started
around the textbooks (Gueudet andTrouche, 2009a). A special website
(Sesaprof) was opened in 2008 for Sesamath resources users. On this site,
users could share their experiences and more than 7000 teachers have
already registered. The association’s present projects comprise, in particular, a resource called LaboMep, incorporating a new version of Mathenpoche
together with other software, which can be easily integrated in a Virtual
Learning Environment and can also be translated into different languages.
Moreover, collaborations started with researchers, in order to improve the
quality of the resources and of their uses.
Sesamath has sought support from the Ministry of Education, but they
have always declined, citing that designing resources is not a part of teachers’ professional roles. The Ministry’s actions to support ICT integration
takes other forms, in particular the development of new modes of assessment (§ 2), and the creation of new training programmes (§ 3).
(2) New assessment procedures, the mathematics practical test at the French
secondary school inal examination (baccalauréat)
It is well known that assessment both raises awareness of the need for and
serves to pilot curricular development. Crucially, curricular development
has raised the awareness in educational institutions of the need for ICT
integration. From this point of view, the case of the mathematics practical
test within the French baccalaureate is very interesting.
ICT in France
25
Since 2007, French high schools piloted a new test (end of 10th grade),
the objective of which was ‘to evaluate students’ competencies in using calculators and some software designed for mathematics [ . . . ] to solve a given
problem’ (MEN, 2007). This new test has deeply (Figure 3.1) modiied the
type of question posed, the nature of the exam and the environment in
which it is sat (ICT explicitly solicited, open-ended questions, examiner has
an active role).
Such a ‘revolution’ has provoked a lot of discussion, protests2, but, little
by little, teachers are changing the ways in which they prepare their students for their inal examination. In an oficial report, a national inspector
(Fort, 2007) writes: ‘this new test forges new relationships between students
and mathematics [ . . . ], it allows students to experiment and check through
using ICT [ . . . ]; it encourages new teaching approaches, giving a more
prominent role to investigative processes’. This report concludes:
the wider adoption of this test, which exists within the frame of the current curriculum, will force mathematics teaching to develop more coherency with its purpose: how could mathematics, with the tools currently
available, solve problems, develop experimentation, and the motivation
for research?
Unfortunately, wider adoption will not occur until 2013 because it is considered better to wait for a change of the inal examination as a whole, rather
than to change one aspect.
Let f be the function deined on R by: f(x) = ⫺x ⫹ x 2 + 4 , its graph C, ␣ a real number,
M and N the points on C with abscissae ␣ and – ␣.
1) Graph C with your chosen software. Call an examiner to check your graph.
2) Try several values of ␣ and make a conjecture about the locus of the point I (the
intersection of the tangents to C through points M and N ). Call an examiner to check
your graph.
3) Determine, as a function of ␣, the coordinates of M and N. Justify your previous
conjectures.
Required outcomes:
– visualization of the locus of point I
– justiied answers to question 2.
Figure 3.1
Example of practical test
26
Mathematics Education with Digital Technology
(3)
Emerging teachers training devices grounded in collective work
Pairform@nce3 was set up in 2006 by the Ministry of Education in France
after a successful experiment in Germany (Intel Lehren-Aufbaukurs
online). It is an in-service teacher training project, aimed at supporting
ICT integration, for any level of class and school domain. In this project,
designers devise training paths, which will be used by teacher trainers
to develop their own training programmes. The training programmes
must comply with certain principles: blended training using a shared
platform; collective preparation of classroom sessions integrating ICT
tools, and a succession of seven stages – introduction of the training,
selection of themes and constitution of teams, co-and self-training, design
of classroom situation, implementation in class, relective analysis and
evaluation.
Thus, from a research point of view, there are many questions that can be
explored about this project, particularly: Can this kind of training modify
teachers’ practices? Can teacher trainers use training paths they did not
design themselves?
Our research and design team (supported by INRP-National Institute
for Pedagogical Research) designed in particular, for the training of
secondary schools teachers (Gueudet et al., 2008), two paths in mathematics: ‘personalisation using e-exercises’ and ‘inquiry-based teaching with
dynamic geometry software’. These paths were simultaneously designed
and tested in 2007–2008; we recorded signiicant evolutions of the trainees’ collective work, they all produced technology-rich lessons, and they
also contributed to the design of the paths by their comments and remarks
about the experimental training. In 2008–2009, these paths were crossexperimented (Artigue, 2007): the designers of one path became trainers
for the other. The familiarization process of the trainers required a signiicant amount of work, and led to important developments: they selected
from the suggested resources, adapted them, added resources, for example,
trainers more acquainted with e-learning added resources for distance
learning, and so on. The trainers contributed to further improving the
design of the paths. Our team designed tools for communication between
trainers and path designers (a trainer logbook in particular, Mialles-Viard
Metz et al. 2009).
In Pairform@nce, like in Sesamath, ICT is associated with collective aspects.
While the collaboration in Sesamath was spontaneous, in Pairform@nce it was
required by the institution, with an aim of developing ICT integration.
ICT in France
27
Despite this essential difference, similarities exist: appropriate tools are
required to support collaboration; the resources must stay alive, integrating
the users’ experience.
(4) New needs for researchers: understanding documentational and
professional geneses
Teachers’ resources, of course, have always been alive, evolving alongside
teachers’ practices. However, this fact is enlightened and intensiied by the
wider usage of online resources. Teachers interact with a lot of resources,
throughout their work, both in and outside of school. It naturally leads to a
more comprehensive notion of what a resource is, to ‘think of a resource as
the verb re-source, to source again or differently’ (Adler, 2000, p. 207),
including everything that teachers are likely to encounter in their work:
ideas of problems, discussions between teachers, orally or online; students’
sheets, and so on.
Conclusion
Following this line, we have proposed a new perspective for the study of
teachers’ professional evolution, where the researcher’s attention is
focused on the resources, their appropriation and transformation by the
teacher or by a group of teachers working together (Gueudet and Trouche,
2009b). In this situation, we distinguish between resources, available for
teacher’s work, and documents, results of this appropriation process. Thus a
document is much more than a list of resources; it is saturated with the
teacher’s experience, like a word, for a given person, is saturated with
sense in a Vygotskian perspective. A document is an encapsulation of
resources, professional experience and knowledge. In this perspective,
there is a strong interaction between documentational geneses and professional
geneses.
It raises sensitive methodological issues: observing long-lasting phenomena and processes, set in different places in and outside of school, particularly in the teacher’s own home, individual processes as well as collective
ones, is a challenge. We nevertheless consider it fundamental to develop
this perspective, if, considering the ocean of contemporary mathematics
education, we want to distinguish between surface waves and deeper
undercurrents.
28
Mathematics Education with Digital Technology
Notes
1
2
3
www.sesamath.net/
See, for example, the Educmath forum: http://educmath.inrp.fr/Educmath/endebat/epreuve-pratique/
www.pairformance.education.fr
References
Adler, J. (2000). ‘Conceptualising resources as a theme for teacher education’. Journal of Mathematics Teacher Education 3, 205–24.
Artigue, M. (2007). ‘Digital technologies: A window on theoretical issues in mathematics education’. In Pitta-Pantazi, D.and Philippou, G. (eds) Proceedings of
CERME 5, pp. 68–82, Larnaca, Cyprus, http://ermeweb.free.fr/CERME5b
(accessed on 6 September 2009).
Bueno-Ravel, L. and Gueudet, G. (2009). ‘Online resources in mathematics: Teachers’ geneses and didactical techniques’. International Journal of Computers for
Mathematical Learning, 14 (1), 1–20.
Fort, M. (2007). Rapport sur l’expérimentation d’une épreuve pratique de mathématiques au
bac S, MEN, on line http://educmath.inrp.fr/Educmath/en-debat/epreuvepratique/rapportep (accessed on 6 September 2009).
Gueudet, G., Soury-Lavergne, S. and Trouche, L. (2008). ‘Soutenir l’intégration des
TICE: quels assistants méthodologiques pour le développement de la documentation collective des professeurs?’ Exemples du SFoDEM et de Pairform@nce.
Communication au colloque DIDIREM, Paris, septembre 2008.
Gueudet, G. and Trouche, L. (2009a). ‘Conception et usages de ressources pour et
par les professeurs : développement associatif et développement professionnel’.
Dossiers de l’ingénierie éducative 65, 78–82.
Gueudet, G. and Trouche, L. (2009b). ‘Towards new documentation systems for
mathematics teachers?’ Educational Studies in Mathematics 71 (3), 199–218.
Mailles-Viard Metz, S., Soury-Lavergne, S. and Daubias, P. (2009). ‘Tool for supporting appropriation of on-line teacher training’. In A. Méndez-Vilas, A. Solano
Martín, J. Mesa González, J. A. Mesa González (eds) Research, Relections and
Innovations in Integrated ICT in Education, Formatex, pp. 845–48. ACTI. halshs00376559, on line www.formatex.org/micte2009/book/845–848.pdf (accessed
on 6 September 2009).
MEN (Ministère de l’Education Nationale) (2007). L’épreuve pratique du baccalauréat
de la série scientiique, on line http://eduscol.education.fr/D1115/epr_pratique_
presentation.htm (accessed on 6 September 2009).
Mission e-Éduc (2008). Pour le développement du numérique à l’école, Rapport
de la mission e-Éduc, on line http://media.education.gouv.fr/ile/2008/
24/5/Pour_le_developpement_du_numerique_a_l_ecole_27245.pdf (accessed on
6 September 2009).
Montessinos, B. and Kuntz, G. (2008). ‘Sesamath: A teachers society, to create
and to spread mathematical resources through the Internet’. Proceedings of the
ICT in France
29
Eleventh International Congress on Mathematical Education , Monterrey, Mexico.
2008
Trouche, L. (2005). ‘Calculators in mathematics education: A rapid evolution of
tools, with differential effects’. In D. Guin, K. Ruthven, L. Trouche (eds), The
Didactical Challenge of Symbolic Calculators: Turning a Computational Device into a
Mathematical Instrument, pp. 9–39, New York: Springer.
Chapter 4
ICT and the English Mathematics
Curriculum
Sue Pope
Programme Manager, Mathematics, Qualiications and
Curriculum Development Agency, UK
Introduction
The use of technology has always been explicit in the statutory curriculum
for mathematics since the irst version in 1988. This included the use of
calculators, Logo and specially developed software. Since then spreadsheets,
graphing packages and dynamic geometry have become much more widely
available. The potential for using Information and Communications
Technology (ICT) to support teaching and learning in mathematics has
never been greater. However, as Ofsted (2008) has found, whereas in the
early days of computer technology in schools mathematics teachers tended
to be in the vanguard, nowadays, students have far less hands on experience
during mathematics lessons. Many teachers now use interactive whiteboards –
but these are largely for presentation purposes.
Several years ago, inspection evidence showed that most pupils had some
opportunities to use ICT as a tool to solve or explore mathematical
problems. This is no longer the case; mathematics makes a relatively
limited contribution to developing pupils’ ICT skills. Moreover, despite
technological advances, the potential of ICT to enhance the learning of
mathematics is too rarely realised. (Ofsted, 2008)
There are six major opportunities for learners to beneit from the use of
ICT in mathematics:
z
z
learning from feedback
observing patterns
ICT in England
z
z
z
z
31
seeing connections
developing visual imagery
exploring data
‘teaching’ the computer
Examples for realizing some of these opportunities are included in QCA’s
recent publication Engaging Mathematics for All Learners. This includes a
range of ways in which teachers are implementing the new secondary
curriculum for mathematics. Examples include:
z
z
z
z
z
the use of digital photographs from situations outside the mathematics
classroom (including PE lessons and a visit to a local playground) as
backgrounds in dynamic geometry software and geometric objects and
graphs can be superimposed;
the use of databases to explore hypotheses in other subjects for example,
the Eyam plague in history;
the use of spreadsheets to investigate the nutritional content of different
meals;
the use of Logo to explore loci;
the use of ICT to allow learners to generate many examples and learn
from feedback.
The New Secondary Curriculum
In 2008 the English secondary curriculum was revised. The curriculum
aims of ‘successful learners, conident individuals and responsible citizens’
were introduced and all the subject programmes of study were represented,
placing greater emphasis on key concepts and key processes and reducing
prescription and content detail.
Explicit reference to the use of technology in the programmes of study
for Key Stage 3 and Key Stage 4 include:
Key concepts (Competence):
1.1c selecting appropriate mathematical tools and methods, including
ICT
Key processes (Representing, Analysing, Interpreting, Evaluating):
2.1b compare and evaluate representations and choose between them
2.2a make connections in mathematics
2.2c visualize and work with dynamic images
32
Mathematics Education with Digital Technology
2.2f explore the effects of varying values and look for invariance and
covariance
2.2k make accurate mathematical diagrams, graphs and constructions on
paper and on screen
2.2l calculate accurately, selecting mental methods or calculating devices
as appropriate
2.2n use accurate notation, including correct syntax when using ICT
2.3d look at data to ind patterns and exceptions
2.4a use a range of forms to communicate indings to different audiences
Curriculum opportunities
4g Become familiar with a range of resources, including ICT, so that they
can select appropriately
If students are to make informed choices about resources, they need to
have used them and understood their potential. This means that they need
hands on experience with a wide range of ICT tools to explore mathematics for its own sake and to apply mathematics in a range of contexts. ICT
allows students to experience, and explore for themselves, multiple
representations. Appreciating the relationships between numerical,
graphical and symbolic representations is a key factor in students’ success
in school mathematics. Dynamic geometry extends this to include geometric
representations.
The Primary Curriculum and Possible Revisions
The national curriculum has always advocated mental methods of calculation as a irst resort and the eficient use of calculators. However it is not
uncommon to see restricted access to calculators in primary school.
Children may have to ‘master written methods’ before they’re allowed to
use a calculator. When children do use a calculator, it is likely to be to
‘check their work’ rather than to explore an aspect of number or operations. Children rarely learn how to use a calculator eficiently, exploiting
its functionality, for example, the use of the memory key or to repeat an
arithmetic process many times.
There is compelling evidence from the national curriculum tests that
many children do not know how to use calculators. The national tests at the
end of primary school comprise a calculator and non-calculator paper.
Many children attempt to use written methods when tackling questions on
the calculator paper.
ICT in England
33
During 2009 the DCSF consulted on proposed changes to the primary
curriculum. It was proposed that the aims for the primary curriculum
should be the same as those for secondary: ‘successful learners, conident
individuals and responsible citizens’. The ‘Essentials for learning and life’
were proposed and these include ICT capability. ICT has been strengthened throughout the primary curriculum proposals to encourage its integration across the curriculum.
Rather than KS1 and KS2 the progression through the primary curriculum was articulated as early, middle and later stages. Examples from the
proposals for ‘mathematical understanding’ include:
z
z
z
z
z
z
Early stage – use of calculators to explore number patterns
Later stage – use ICT to represent number patterns as graphs and using
simple formulae
Later stage – use spreadsheets to model inancial situations
Later stage – use a calculator eficiently as one of a range of strategies for
calculation
Geometry – use ICT to generate instructions for movement, generate
and explore geometric patterns and problems
Statistics – use ICT to store, structure and analyse data, that has been collected for a purpose, to explore possible relationships and interpret
indings
These proposals are informed by research and best practice. There is considerable evidence that using calculators from an early age as an exploratory tool can enhance understanding of number and operations.
ICT and Assessment
While the curriculum expectations around the use of ICT are clear, one of
the key factors that impacts on how the curriculum is implemented is assessment. Teacher assessment (TA) is expected at the end of key stages and
should be based on the rich entitlement set out in the national curriculum.
Alongside TA there has been national testing at the end of KS 1, 2 and 3
since the early 1990s and public examinations at the end of KS4. At KS1 the
tests are non-calculator and at all other key stages comprise both calculator
and non-calculator components.
In October 2008 the government announced the end of KS3 national
tests. This represents an exciting opportunity to reinvigorate TA and
34
Mathematics Education with Digital Technology
ensure that it does indeed draw on a rich evidence base which includes the
use of ICT. Since 2008, Assessing Pupils’ Progress (APP) has been introduced to schools as part of the DCSF’s Assessment for Learning Strategy. APP
is intended to revitalize TA across both primary and secondary. APP introduces periodic assessment which involves teachers standing back and making a holistic judgement about their learners’ achievements and planning
next steps and adjustments to their teaching. Teachers are encouraged to
draw on a rich evidence base which may include tests and ‘assessment
tasks’ but is not solely reliant on them. Periodic assessment should take
place, at most, two or three times a year and teachers are advised to start
with a small sample of learners. The APP criteria are based on the national
curriculum level descriptions. For more about APP see the QCDA curriculum website.
Using ICT in formal assessments, such as national curriculum tests and
general qualiications (e.g., GCSEs, GCEs) may be a long-term goal but is
certainly unlikely in the medium term. The logistics of learners having
access to ICT, other than calculators, in timed written examinations is not
currently practicable. Until 2007 students had to complete course work as
part of their GCSE; this could include the use of ICT in an extended piece
of work. From 2010, GCSE mathematics will have 25–50 per cent noncalculator assessment, a revision from the current 50 per cent. In addition,
the GCSE will include a greater proportion of application and problem
solving (from 20% to 50%) to relect the priorities of the new curriculum.
This may provide a greater impetus for teachers to ensure their students do
know how to use a calculator (or graphing calculator) effectively.
For post-16 learners as well as GCE, AS and A level mathematics there are
free standing mathematics qualiications (FSMQs). FSMQs are available at
NVQ levels 1, 2 and 3 (i.e., GCSE grade G–D, GCSE grade C+, GCE respectively) and are intended to support learners’ other areas of study. They
focus on developing understanding through application. Level 3 FSMQs
can be combined to gain an AS use of mathematics. The possibility of a full
A level in use of mathematics is currently under consideration. This new A
level would include the assessment of extended pieces of work based on
using mathematics for modelling and problem solving. The use of ICT is
integral to FSMQs and graphing calculators are expected in the assessment
of all level 3 FSMQs. For more than ten years there has been a non-calculator
paper in GCE mathematics, the removal of this requirement was recently
proposed – and there are many arguments for and against this proposal.
ICT in England
35
Practical Considerations
Providing students with hands on access to ICT during normal mathematics lesson is a challenge for many schools. These are some of the ways that
schools make ICT available:
z
z
z
z
a mathematics classroom with a number of networked PCs around the
edge of theroom in which small groups of students access a range of
software
a set of laptops for use by pairs of students
a set of calculators, graphing calculators or other hand-held devices
that students use alone or in pairs to explore sets of data, plot graphs,
and so on
a wireless network linking a set of hand-held devices to the teacher’s PC.
Whatever choices are made by schools, teachers and departments, the use
of technology is likely to remain a key element of the required curriculum.
References
DCSF. (2008). Assessment for Learning Strategy. http://www.education.gov.uk/
publications/eOrderingDownload/DCSF-00341-2008.pdf (accessed on 11 July
2009).
Ofsted. (2008). Mathematics: Understanding the Score. http://www.ofsted.gov.uk/
Ofsted-home/Publications-and-research/Browse-all-by/Documents-by-type/
Thematic-reports/Mathematics-understanding-the-score (accessed on 11 July
2009).
QCA. (2007). National Curriculum. www.curriculum.qcda.gov.uk (accessed on 11
July 2009).
—(2009). Engaging Mathematics for All Learners. www.qcda.gov.uk (accessed on 11
July 2009).
Part Two
What Does Research Tell Us?
In this section, authors write about the role that Information and Communications Technology (ICT) has to play in the learning of mathematics,
drawing on their own and others’ research. Keith Jones considers some of
the issues surrounding using ICT to support teaching geometry. Looking
back at the hopes and expectations of earlier writers, he relects on some of
the reasons that technological progress may not have materialized in the
classroom to the extent anticipated. Don Passey reports on a longitudinal
study carried out in the United Kingdom, analysing the impact that interactive whiteboards can have on the learning and teaching of mathematics.
Many aspects of the ways in which cognitive and motivational processes are
supported are considered. Walter Stroup, Lupita Carmona and Sarah M.
Davis then present their research into the impact of using ‘NetworkSupported Function-Based Algebra’ (NFBA) for supporting the teaching of
a standard algebra course in the United States. This use of graphical calculators is offered as an example of a ‘forward looking’ intervention to help
prevent underperformance rather than a ‘backward looking’ remediation
or corrective strategy.
All three provide further evidence that technology can undoubtedly be
used to improve engagement and understanding – But what structures
need to be in place, both nationally and locally, to support all teachers to
harness this potential?
Chapter 5
The Value of Learning Geometry with ICT:
Lessons from Innovative Educational Research
Keith Jones
University of Southampton, UK
Introduction
The 40th anniversary of the launch of the British Journal of Educational
Technology (BJET) took place in 2009. Also in 2009, coincidentally, ATM
instigated MTi (Mathematics Teaching interactive), an online web-based
publication. The irst issue of BJET (in 1970) was most concerned with the
availability of audio-visual resources (such as 16mm ilm projectors), whereas
the irst issue of MTi contained, among other things, an article which
examines questions for which the answer is ‘It’s a parabola’ (see Figure 5.1
for an example).
Figure 5.1
Sand Dune in Morocco (photo by Fabio Cologna)
40
Mathematics Education with Digital Technology
Initiatives such as MTi are symptomatic of the changes in technology that
have taken place over the period since the launch of BJET – computing
power has become more ubiquitous, technologies have converged, and the
emphasis is increasingly on interactivity that exploits learners’ visual and
spatial intuition. All this means that it is instructive to review the value of
learning school geometry with ICT, given that geometry is both a key component of mathematical theory, and the quintessential visual and spatial
element (Jones, 2002a).
In what follows, the research selected focuses on learners’ use of interactive geometry software, the design of suitable teaching and learning activities, and the nature of relevant teacher professional development. The
central theme of the paper is that while ICT has considerable potential in
enlivening the teaching and learning of school geometry, there is much to
take account of in terms of enabling this potential to be fully realized.
The visual and spatial interactivity offered by ICT means that dynamic
geometry software (DGS; examples include Cabri, GeoGebra, Sketchpad, etc.)
has become perhaps the best researched area in mathematics education
(for a review, see Jones, 2002b). At irst glance, dynamic geometry software
(DGS) is nothing more than a drawing package. Yet a DGS is more than a
simple program for graphics because the user can not only specify geometric relations between initial objects (such as points and lines) but can also
grasp such objects and drag them. In a classroom research project (Jones
2000), a class of 12-year-old pupils was studied as they completed a module
of work on the topic of the properties of quadrilaterals. The aim of the
study was to document the meanings that pupils gained of deductive reasoning through experience with DGS software. It was anticipated that their
meaning would likely be shaped, not only by the tasks they tackled and
their interactions with their teacher and with other pupils, but also by
features of the software.
The evidence from the research study indicated that while using DGS
does provide learners with a way of working with geometrical theorems, this
is mediated by features of the software, especially in the vital early and intermediate stages of using the software. The research illustrates that even with
carefully designed tasks, sensitive teacher input and a classroom environment that encourages conjecturing and a focus on mathematical explanation, it can take quite some time for the beneits of using DGS to emerge.
For example, learners take time to understand not only the uses that can be
made of the facility to drag on-screen objects, but also what is entailed in
constructing an on-screen igure in a way that fully utilizes relevant
geometrical theory. Not only that, but a particular issue is whether the
Learning Geometry with ICT
41
opportunities offered with DGS to ‘see’ mathematical properties with such
on-screen support might reduce or even replace any need for mathematical
proof – or, on the contrary, whether new ways of promoting learners’ understanding of the need for, and the roles of, proof might open up (Hoyles and
Jones, 1998).
The issue of time also emerges when one considers what is involved in
designing teaching and learning activities for geometry. Research on designing teaching scenarios based on various forms of geometry software, and of
integrating them in the regular course of classroom teaching, shows that it
can take quite a long time to reach the point where tasks genuinely take
advantage of the computer environment (Brown et al., 2003; Christou et al.,
2006, 2007; Zachariades et al.; 2007). Such research indicates that geometry
tasks selected for use in the classroom should, as far as possible, be chosen
to be useful, interesting and/or surprising to pupils. In addition, it can be
helpful if classroom tasks expect pupils to explain, justify or reason, and be
critical of their own, and their peers’ explanations. In particular, the generating of data or the use of measurements, while playing important parts in
mathematics, and sometimes assisting with the building of conjectures, are
probably best not as an end point to pupils’ mathematical activity. Indeed,
where sensible and in order to build geometric reasoning and discourage
over-reliance on empirical veriication, classroom tasks might use contexts
or approaches where measurements or other forms of data are not generated. In addition to taking time to reach the point where tasks genuinely
take advantage of ICT, the issue of inding how to manage classroom time
well during actual teaching is also something that research shows has to be
worked on.
An especially interesting conundrum relates to using ICT for 3D geometry (Christou et al., 2006; Jones et al., 2009b). It may seem, at irst sight,
rather odd to be working in 3D geometry on a lat 2D computer screen. Not
only that, but the issue of representing 3D objects on a lat screen means
that a number of design decisions, unique to 3D software, need to be made
by software developers – one being the key decision of how the opening
software screen both orients the user to 3D space, and provides a framework for the creation of 3D igures and structures. Inevitably, this has been
tackled in different ways by different software developers, yet what learners
make of such differences is currently under-researched. What is raised is
the issue of just how ‘direct’ is what is often called ‘direct interaction’ when
using ICT for geometry. As digital technologies develop, it is unclear if
learners do feel that they are interacting ‘directly’ with geometrical theory;
what learners may experience is rapidly moving dynamic on-screen images
42
Mathematics Education with Digital Technology
that seem more like computer-generated imagery. The question remains
about how the learning of geometry can be facilitated through different
digital technologies in a way which successfully builds upon the visual intuition that all of us require in order to understand our experience of physical and mathematical space.
The need to understand learners’ use of interactive geometry software,
and the need to be able to design suitable teaching and learning activities,
point to the importance of research on forms of suitable teacher professional development. In a project involving experienced teachers collaborating in developing ways of providing professional development and support
for other teachers (Jones et al., 2009a), a particularly promising approach
to stimulating professional conversations about teaching approaches was
the framework illustrated in Figure 5.2.
In the teacher-demonstration approach, the teacher engages students in
discussing an on-screen geometric construction and may ask questions
about the objects on the screen to get the learners to explain what they
might expect would happen if some parts of the coniguration were moved
or changed. This approach was found to allow teachers with little experience of using technology in the classroom to experiment with the technology with relatively small risk of things going wrong. In addition, this
kind of use requires less change in the classroom setting and needs fewer
resources than either organizing classes into a computer room or using a
class set of laptops in the regular classroom. The second approach (in
Figure 5.2) entails teachers providing previously created interactive iles for
their learners. With such teacher-created iles, students can experiment
with dynamic objects. This provides clear boundaries for learners and time
is not spent setting up the tasks; rather, learners can spend time exploring
the mathematics that is central to each task. No doubt there is quite some
teacher control over the material, but the approach can bring in opportunities for creative thinking and problem solving by learners. The third
approach (in Figure 5.2) involves learners creating their own iles, perhaps
Pedagogy
Teacher demonstration
Figure 5.2
Pupils interact with
teacher created files
Pupils create their own
files
Framework of Teaching Approaches with Geometry Software
Learning Geometry with ICT
43
for other learners to tackle. This approach provides some learner ownership of the work and engages a different sense of problem solving and
thinking by creating that ownership. There is also the development of
independence – in learning how to use the software, and with additional
scope for student creativity and discovery. In the research project, this
framework of teaching approaches provided both a way of structuring discussion during teacher CPD sessions, and a prompt for further discussion
and further work – supported online through the provision of a wiki. All
this points to ways in which teaching approaches developed by teachers can
be used to stimulate further professional development by creating a network of teachers who are looking to enhance their sue of ICT in the teaching and learning of geometry.
Given these indings from research, it is instructive to note that the irst
issue of BJET, in 1970, included a review of Oettinger’s (1969) book on the
‘mythology of educational innovation’. In the book, Oettinger concluded
that, at the time, ‘education technology has not reformed – much less revolutionized – education’ (ibid., p. 215). This prompted the BJET reviewer to
observe that the major contribution of the book was that of ‘alerting educators . . . to unrealistic technological expectations and heading off widespread disenchantment which might hinder the progress of educational
technology’ (Seatter, 1970, p. 79).
Conclusion
The main message of this chapter is that the undoubted, and so far unparalleled, affordances of ICT, must be measured against the complexity of classroom learning, the demanding role of teacher and the need for relevant
professional development. While access to computing power may shortly
no longer be a source of an unbridgeable ‘digital divide’, differential access
to networks of people that provide support for, and nurturing of, educational innovation via ICT may be an emerging new form of ‘digital divide’.
As Oettinger warned some 40 years ago, it can be that expectations of
technology appear unrealistic. Even with a classroom with suitable equipment, and with supportive institutional and national policies, such things
may not be enough to counter the Ofsted claim about school teaching in
mathematics in England makes a ‘relatively limited contribution to developing pupils’ ICT skills’ (p. 27) and that ‘despite technological advances,
the potential of ICT to enhance the learning of mathematics is too rarely
realised’ (Oettinger, 1969). In developmental psychology the notion of
44
Mathematics Education with Digital Technology
canalization has been widely invoked, mostly in a nurture/nature argument
(see e.g., Gottlieb, 1991). Yet the idea (captured by the term ‘canalization’)
that there is a ‘normal’ pathway of development and that this can withstand
‘great assaults or perturbations and still return to (or remain on) its usual
developmental pathway’ (ibid., p. 4) might have the potential to illuminate,
at least to some extent, the issue at the heart of this chapter – that of why,
despite the widely-acknowledged potential of ICT, integration into mathematics teaching and learning has proceeded much more slowly than some
have predicted.
References
Brown, M., Jones, K. and Taylor, R. (2003). Developing Geometrical Reasoning in the
Secondary School: Outcomes of Trialling Teaching Activities in Classrooms, a Report to the
QCA. London: QCA.
Christou, C., Jones, K., Mousoulides, N. and Pittalis, M. (2006). ‘Developing the
3DMath dynamic geometry software: Theoretical perspectives on design’. International Journal of Technology in Mathematics Education, 13 (4), 168–74.
Christou, C., Sendova, E., Matos, J-F., Jones, K., Zachariades, T., Pitta-Pantazi, D.,
Mousoulides, N., Pittalis, M., Boytchev, P., Mesquita, M., Chehlarova, T. and
Lozanov, C. (2007). Stereometry Activities with DALEST. Nicosia, Cyprus: University
of Cyprus.
Gottlieb, G. (1991). ‘Experiential canalization of behavioral development: Theory’.
Developmental Psychology, 27, 4–13.
Hoyles, C and Jones, K. (1998). ‘Proof in Dynamic Geometry Contexts’. In:
C. Mammana and V. Villani (eds), Perspectives on the Teaching of Geometry for the 21st
Century (ICMI Study 8), pp. 121–28. Dordrecht, The Netherlands: Kluwer
Academic Publishers.
Jones, K. (2000). ‘Providing a foundation for deductive reasoning: Students’ interpretation when using dynamic geometry software and their evolving mathematical
explanations’. Educational Studies in Mathematics, 44 (1–3), 5585.
—(2002a). ‘Issues in the teaching and learning of geometry’. In Linda Haggarty
(ed.) Aspects of Teaching Secondary Mathematics, pp. 121–39. London: Routledge.
—(2002b). ‘Research on the use of dynamic geometry software’. MicroMath, 18 (3),
18–20.
Jones, K., Lavicza, Z., Hohenwarter, M., Lu, A., Dawes, M., Parish, A. and Borcherds,
M. (2009a). ‘Establishing a professional development network to support teachers using dynamic mathematics software GeoGebra’. Proceedings of the British
Society for Research into Learning Mathematics, 29 (1), 97–102.
Jones, K., Mackrell, K. and Stevenson, I. (2009b). ‘Designing digital technologies
and learning activities for different geometries’. In Celia Hoyles and Jean-baptiste
(eds), Mathematics Education and Technology: Rethinking the Terrain (ICMI Study
17), chapter 4, 47–60. New York: Springer.
Learning Geometry with ICT
45
Oettinger, Anthony G. (1969). Run, Computer, Run: The Mythology of Educational
Innovation. Cambridge, MA: Harvard University Press.
Seatter, 1970. ‘An essay of mythology’. British Journal of Educational Technology, 1 (1),
74–79.
Zachariades, T., Jones, K., Giannakoulias, E., Biza, I., Diacoumopoulos, D. and
Souyoul, A. (2007). Teaching Calculus Using Dynamic Geometric Tools. Athens,
Greece: University of Athens.
Chapter 6
Learning Mathematics Using Digital
Resources: Impacts on Learning and Teaching
for 11- to 14-year-old Pupils
Don Passey
Department of Educational Research, Lancaster University, UK
Introduction
This chapter explores impacts on the teaching and learning of mathematics
when particular digital resources are used through the medium of interactive whiteboards. The impact of technologies on subject attainment and
achievement (in mathematics as well as in other subject areas) has been a
focus of a number of research studies, which have adopted a range of
research approaches, both qualitative and quantitative. Enhanced subject
attainment was identiied in some studies (in Becta, 2001, 2003; Harrison
et al., 2002), while Cox et al. (2003) reviewed reasons for these gains. When
technologies are used in teaching and learning, a commonly reported gain
by both teachers and pupils is enhanced motivation in subject activities.
Some studies have identiied aspects of speciic positive motivational impacts
(see Passey et al., 2004; Cox, 1997; Denning, 1997), and some instances
studied have involved uses of digital resources. This chapter reports outcomes from a national evaluation studying motivational, learning and teaching gains when digital resources were used in mathematics lessons with
11- to 14-year-old pupils in a range of schools. The argument presented in
this chapter is that digital resources provide enhancements for learners that
are recognized as being motivating, that increased motivation can be linked
to enhanced beliefs in abilities to undertake and engage with mathematics
(in which discussion, enhanced understanding and conceptualization play
important roles), and that speciic ways in which learning is enhanced can
be described by observers, teachers and pupils themselves.
Learning Mathematics Using Digital Resources
47
The Project Studied
Digital resources are often made accessible to pupils in classrooms through
the medium of an interactive whiteboard. A 3-year project (the Maestro
Project) was set up by Research Machines Education plc in 2003, initially
involving 27 schools, to explore how digital resources (RM MathsAlive and
mathematical resources available from other companies such as MyMaths),
when used in a number of mathematics classrooms and departments, and
supported externally, might impact on mathematics learning and teaching.
The digital resources covered a complete curriculum for mathematics
across Key Stage 3 (for pupils 11–14 years of age). Although resources were
initially designed to support learners gaining average attainment, teachers
accessed or developed resources to suit widely different pupil groups in
terms of their mathematical knowledge and attainment. The digital
resources, originally developed to meet the objectives of the Secondary
National Strategy framework for teaching mathematics (DfEE, 1999), provided
teachers with video openers (for watching and listening to), mental starters
(tackling short problems with quick-ire or timed responses), speciically
created interactive whiteboard screens (covering a speciic topic or mathematical problem using features such as cover and uncover), main activities
(up to about an hour in length and using additional physical resources
such as counters or bricks), worksheets (mainly of a textual nature, for
printing off and completion), games (using full multimedia and involving
groups or teams competing against the clock or each other), and assessment exercises (designed to identify attainment levels). The resources were
designed for easy access and use on interactive whiteboards, as well as for
use in computer suites or computer clusters where learners could access
resources more individually. Some graphical calculator activities were also
available, and schools could set up pupil access beyond the school. Access
to all resources was supported through an ICT-based management system,
a virtual teaching and learning environment through which teachers could
select digital resources.
Background to the Study
Although research shows that features of digital resources can have a major
impact on learning when interactive whiteboards are used, a review of the
academic literature (Higgins et al., 2007), pointed out that explanations of
how impacts were arising was sparse. While the distinction drawn by
48
Mathematics Education with Digital Technology
Kennewell and Beauchamp (2007) between two sources of affordances
(‘those intrinsic to digital media and devices and those constructed by
hardware designers, software developers and teachers preparing resources
for learning’) was dificult to make when identifying outcomes in this study,
it was clear that speciic digital resources offered speciic affordances that
impacted upon learning engagement and outcomes (argued further in
Passey, 2006). While it can be argued that evidence about uses of a speciic
range of digital resources potentially limits the gathering of more circumspect indings, it can also be argued that speciic digital resources need to
be studied in depth in order to identify and understand in detail the speciic
learning impacts arising.
Methodological Approaches
Evidence about uses and outcomes of digital resources was gathered through
teacher interviews (from 19 key teachers and 19 heads of mathematics or
senior managers), pupil interviews (open questions were asked of 57 pupils,
30 boys and 27 girls, largely in Year 9, across 16 schools), pupil questionnaires (with 20 questions posed in positive and negative ways to check reliability of responses, with 426 pupils providing responses, 164 girls and 251
boys, while 11 pupils declined to indicate gender), and lesson observations
(in 18 lessons in different schools). Questions asked of pupils and teachers
focused on: levels of use of resources; whether a curriculum scheme was
used; how lessons were planned; perceived beneits and disadvantages of
the resources; enjoyment; perceived impacts, whether expectations had
been affected; impact on workload; perceived impact on connections to
concepts, enhancements to understanding, retention or recall; perceived
impacts on motivation, speciic resources of value, impacts on speciic individuals or groups, home use, application across year groups and the key
stage and forms of support used and valued. Observations in classrooms
focused on complementary issues: group features (size, gender mix and
prior attainment); lesson objectives; classroom layout (the position of the
interactive whiteboard, laptop or computer equipment, static whiteboards,
windows and lights); timings and lengths of speciic activities undertaken
(the form of activity, forms of Information and Communications Technology
(ICT) used, and forms of teacher and pupil interactions involved); evidence
of metacognitive skills focused on or developed; evidence of enhanced discussion about mathematical strategies and evidence of transfer of learning
(the providing of hooks or making links to prior or future learning).
Learning Mathematics Using Digital Resources
49
Impacts Reported by Learners
Overall, questionnaire responses from pupils were positive, with key
responses indicating positive attitudes towards mathematics and the use
of interactive technologies to support the learning of mathematics (largely
supported both by teacher responses and independent observations).
Pupil responses indicated that many had continued to enjoy mathematics,
and that their enjoyment had increased over the period of the 3-year
project; 63 per cent indicated that their enjoyment of mathematics
had increased since the beginning of Year 7, 65 per cent indicated that
their enjoyment had increased since the previous year, and 81 per cent
indicated that they felt they could learn new things more easily than they
could at the start of Year 7. These responses suggested that activities
in these classrooms were facilitating enjoyment and positive forms of
motivation (goal performance and academic eficacy). When asked
whether they enjoyed using interactive whiteboards in mathematics
lessons, 87 per cent of pupils agreed or agreed strongly. One link between
levels of responses regarding enjoyment, positive motivations for learning, and enjoyment of uses of interactive whiteboards was suggested by
pupils’ responses to a question asking whether they found it easier to
remember things when they used the interactive whiteboard; in total,
71 per cent agreed or agreed strongly. Whether these levels could be
explained by impacts of certain types of resources was explored in other
questions. Pupils were asked whether they enjoyed playing mathematical
games, and 58 per cent agreed or strongly agreed. When asked if the playing of mathematical games helped them to remember things, 69 per cent
agreed or agreed strongly. Questionnaire responses indicated that digital
resources were having positive impacts on many pupils, and their learning of mathematics.
How Digital Resources Were Used in Lessons
Observations showed that teacher practices could have a dramatic effect
upon impacts on learning. In some lessons observed, uses of digital
resources matched ways that pupils described learning being enhanced.
From lesson observations and pupil interviews (although it should be noted
that points raised by pupils were gained from open rather than closed questions, so frequencies of responses given might not be as high as those
identiied using closed questions), ive particular ways in which teachers
50
Mathematics Education with Digital Technology
used digital resources were seen to inluence impact, pupil involvement
and gain:
Enhancing visual clarity
The fact that a shape was shown accurately, rather than as a sketch, was
potentially signiicant. Most people (including groups of teachers when
asked) remember a square as a clear four-sided object with equal sides,
subtended by a 90° angle at each corner. This form of memorized image
allows the ‘rules of being a square’ to be related through the memorized
image. If a square is depicted as a sketch, then the rules of being a square
need to be remembered separately and applied to this object. Remembering the object as a clear square means that the rules can be ‘seen’ more
readily. Some pupils explained that digital resources offered ‘exact and
clear’ images (5 pupils), and that having an exact image meant that they
could remember ‘a real image’. Some pupils said that digital resources were
easier to read than when handwriting was done on a static board (3 pupils),
others commented on the importance of colour and brightness in drawings
(4 pupils), while yet others explained that the layout of topic details was
better (2 pupils). Some pupils said the large size of objects allowed them to
see things easily (3 pupils), while some explained that animations and diagrams helped their understanding through visualization (11 pupils) and
‘simplicity’ (1 pupil).
Clarifying a process
Some pupils referred to digital resources as being a point of reference that
everyone could see (4 pupils), that enabled more discussion on topics
(3 pupils), and that teachers explained more how to solve problems
(1 pupil). The discussion of strategies and approaches to problems meant
that pupils had the chance to clarify processes involved. Pupils not only had
the chance to consider how others were tackling process, but also the
chance to verbalize process. It is arguable (see Vygotsky, 1978) that verbalization is as important as (if not more important than), undertaking a series
of examples in silence, written into exercise books.
Developing conceptual understanding
Some pupils explained that digital resources helped them understand
certain topics, particularly shape (10 pupils), trigonometry (8 pupils),
mental mathematics with addition, subtraction, multiplication and division
(7 pupils), algebra (3 pupils), graphs (3 pupils), fractions and decimals
(3 pupils), times tables (3 pupils), co-ordinates and grids (2 pupils), averages
Learning Mathematics Using Digital Resources
51
(1 pupil), stem and leaf diagrams (1 pupil), and scatter diagrams (1 pupil).
Other pupils explained that work was broken down into steps rather than
being ‘in big chunks in a text book’ (4 pupils). When presented with ‘loads
of writing’ this was found to be daunting, and pupils then believed that
they could not do the work. Moving imagery was a key means for pupils
to ‘see what is meant’, rather than their trying to ‘imagine what is meant’
when only described by teachers. Imagining what is meant can mean that
pupils have to imagine the steps in a process, or the low of a phenomenon.
Using still and moving imagery meant that pupils could see these aspects,
so understanding could be modelled rather than assumed.
Encouraging participative learning
Some pupils felt that games were interesting, and that this aspect alone
helped them (12 pupils), while others felt it was ‘good for exercising the
brain’ and ‘drawing you into thinking’ (2 pupils). Some pupils said that
games activities helped all the class to work together, so that everyone was
involved (6 pupils), so that pupils helped each other (2 pupils), and that
competitive activity ‘gets brains working’ (3 pupils). Many pupils referred
to different aspects of participative learning, whether this was in terms of
increased opportunities for group discussion or all individuals from across
a class taking part in games. Participative learning was important for two
groups of pupils: those who had dificulty in participating because of low
engagement levels and those who felt uncomfortable when some pupils
were not engaged in lesson activities.
Increasing pace and variety
Some pupils said that they remembered things when they actively used
digital resources but did not have to copy and write (17 pupils); they
explained that they listened more (1 pupil), that it attracted them like a
television would (1 pupil), and that it offered more variety (2 pupils).
Pupils here were challenging the belief that copying and writing is the
most vital means to support learning, when other alternatives exist. Some
pupils felt the dynamics of lessons had changed, that they were conducted
at a quicker pace, since the teacher had resources prepared and loaded in
advance (7 pupils). Some pupils felt that a slow pace meant they lost focus
and did not maintain attention. With a faster pace, they felt they could
understand the low better, and could easily go back to things they were
not certain about (although there is need for some caution, as some teachers felt that some pupils did not beneit in this respect, especially those
who needed more time to consolidate learning, and indeed other studies
52
Mathematics Education with Digital Technology
have pointed to pupils reporting increased pace to be a disadvantage (see
Wall et al., 2005), while Smith et al. (2006) observed in their study that
increased pace arose due to a higher level of questioning but with associated answers of a briefer nature). Pace enabled a better low to be maintained, both for those who were distracted by breaks in low, and for those
where understanding was interrupted by breaks in low. Using digital
resources meant that different activities could be introduced more seamlessly, without long periods of waiting between one activity ending and the
next one starting.
Analysing the Width of Reported and
Observed Impacts on Learning
Although digital resources impact on learning, it is clear that they do not
impact to the same extent on each aspect of learning. A range of learning
elements in framework format can be used to explore width of impact
(shown in Figure 6.1). For this analysis, aspects of learning are grouped and
detailed in six broad categories: megacognitive (using the work of Vygotsky,
1978; Bransford et al., 2000); cognitive (using the work of Bloom, 1956;
Child, 1973; Gardner, 1991; DfES, 2006); metacognition (using the work of
Presseisen, 2001); motivation (using the work of Passey et al., 2004); social
interactions (using the work of Lave and Wenger, 1991; Twining and
McCormick 1999); and societal implications (using the work of Lipman,
1995; Moseley et al., 2005). These aspects and categories are fully deined
and described elsewhere (in Passey, 2008). Using evidence from pupils,
teachers and observations, aspects of learning where impacts have been
found are shaded in the framework.
From Figure 6.1 it is clear that certain aspects of learning are affected to
greater extents than are others. Digital resources are impacting on:
Megacognitive elements
Digital resources were not used generally to provide a ‘big picture’ for
pupils. In terms of working within Zones of Proximal Development, many
teachers selected resources and activities appropriate to the mathematical
skills and understanding of pupils, or adapted resources to accommodate
the needs of gifted and talented pupils or those with speciic educational
needs. While some teachers were concerned with transfer of previous learning into lessons, only a minority focused on transfers of learning to future
situations beyond lessons.
53
Learning Mathematics Using Digital Resources
MEGACOGNITIVE
Knowing about the big picture
Working in a Zone of Proximal
Development
The transfer of learning
COGNITIVE
Internalization
Acquisition or
reception
Visual
Attention
Auditory
Kinaesthetic
Emotional
Sensory
stimulus
Social
Textual
Musical
Interpersonal
Intrapersonal
Internal cognitive processing
Searching
Generating or developing ideas
Hypothesizing
Subject knowledge
Imagining
Gaining skills
Gaining understanding
Skills
Understanding
ICT knowledge
Creativity
Acquisition
Enquiring
Comprehension
Questioning
Concept formation
Conceptualizing
Reconstruction of
ideas
Application
Thinking
Knowledge
handling
Analysis
Synthesis
Evaluation
Comparing
Reasoning
Interpreting
Figure 6.1
Continued
54
Mathematics Education with Digital Technology
Visual
Visual
Rehearsal
Auditory
Auditory
Kinaesthetic
Kinaesthetic
Emotional
Retention
Emotional
Social
Social
Recall
Textual
Textual
Musical
Musical
Short-term
memory
Interpersonal
Intrapersonal
Long-term
memory
Interpersonal
Intrapersonal
Externalization
Writing
Reporting
Speaking
Presenting
Motor stimulus
Drawing
Completing
Moving
METACOGNITIVE
Knowing place, sequence
Monitoring task performance
Detecting and correcting errors
Pacing of work
Focusing attention on what is needed
Selecting and understanding appropriate
strategy
Relating what is known to material to
be learned
Testing the correctness of a strategy
MOTIVATIONAL
SOCIETAL
SOCIAL
Instruction
Learning goal
Identiied
regulation
Intrinsic
motivation
Appreciative
Explanation and
illustration
Academic efficacy
Learner
interaction
Direction
Demonstration
Discussion
Active
Caring
thinking
Normative
Effective
Empathetic
Scaffolding
Figure 6.1 Continued
55
Learning Mathematics Using Digital Resources
Performance
approach goal
Questioning
Speculation
Performance
avoidance goal
Ecternal
regulation
Amotivation
Consolidation
Summarizing
Initiating and
guiding
exploration
Education
Contextual
thinking
Citizenship
Work
Recreation
Evaluation
pupils’
responses
Figure 6.1 Framework Showing Impacts of Digital Resources Used to Support
Learning and Teaching of Mathematics
Cognitive elements
Multi-sensory learning elements: Digital resources helped to maintain
attention, a number of sensory routes were stimulated, and acquisition and
reception of ideas or knowledge were encouraged. Attention was maintained because of size of images and text, clarity and detail, colour and
movement. Handwriting by teachers alone on screens was much less effective, but handwritten annotations on prepared resources could readily highlight aspects for pupils. Uses of timers to count down, of sound to indicate
when things had been achieved, of covered items that could be uncovered,
and pupils touching the interactive whiteboard with pens or ingers to show
how they had tackled problems, all added to the richness and diversity of
the multi-sensory dimension.
Knowledge acquisition: The digital resources supported knowledge handling through clarity and visibility. Pupils recognized both the value of having clear images, and the importance of accessible examples at the time
they were asked to think about a mathematical issue. Pupils could see
images clearly when working with aspects of shape and space.
Concept formation: Clarity, visibility and visualization all helped with concept formation. Understanding what happened to the shape of a graph for
the equation ‘y = mx + 10’, when m was 0, 1, 2 or any other number, could
be visualized more easily if the graph was very quickly generated and able to
be compared to previous graphs. Simulations, animations and the comparison of results all supported the formation of concepts, explored also in
Murphy et al. (1995), while Wall et al. (2005) report on visual effects helping learning.
56
Mathematics Education with Digital Technology
Higher order thinking skills: In some lessons observed, teachers used
digital resources in novel ways to explore an analysis of data. Digital
resources allowed batches of data to be built up, with pupils directly
involved in ‘handling’ the data, seeing what happened to the mean, mode
and median when greater quantities were built up. Using resources, teachers engaged pupils in open discussion, and encouraged them to draw ideas
from their existing knowledge, as well as asking them to indicate how far
they accepted their peers’ ideas and strategies for addressing problems.
Knowledge retention and recall: Clarity, visibility, and visualization leading
to effective modelling and holding of rules and ideas appeared to have
impact on knowledge retention and recall. Kozma (1994) refers to increased
recall arising when imagery and diagrams are used alongside text: ‘such
structures are more memorable than those constructed with text’.
Externalization: Teachers moved away from using writing as the only (or
major) form of externalization. Some teachers reported impacts on teaching, moving from pupil writing to more pupil discussion. Discussion and
presentation were more prominently used by a number of teachers to offer
effective ways to support externalization of knowledge and understanding.
In some lessons observed, pupils came to the interactive whiteboard to
show how they had undertaken a task, and to present this to the rest of the
class.
Metacognitive elements
In a few lessons observed, digital resources were used to offer pupils opportunities to ind out if they were right or wrong, to address misconceptions
and to identify how to do better next time. Teachers in some lessons were
able to annotate screens, and to point out speciic detail to help to focus
the attention of pupils. The technology enabled pupils’ work to be shared
more easily; allowed them to show how they produced an answer and gave
the opportunity to create and test general rules.
Motivational aspects
Some pupils explained that work was broken down into steps, which was
more motivating than being ‘in big chunks in a text book’. Some teachers
believed that pupils were motivated because they saw mathematical ideas
presented through a ‘recognized resource’ as being akin to a ‘universal
truth’. Many pupils felt that they could tackle mathematics more readily
when using digital resources, and some showed that their expectations
could be raised. One pupil pointed out to another who was trying to create
Learning Mathematics Using Digital Resources
57
an angle of 90° using Geometer’s Sketchpad that making an angle of 90.9° was
‘poor’. The pace of lessons was also felt by pupils to help their motivation.
Social interactions
Some teachers believed digital resources allowed lines of questioning to be
explored more. Haldane (2007) suggests that:
While the recall of content from the computer’s memory to the screen is
not quite as rapid as the process of verbally articulating some knowledge
held within the human mind, it is nevertheless fast enough to enable a
striking intervention in the dialogue to be made in a way that commands
attention and prompts further dialogue.
Pupils in some lessons were given opportunities to discuss questions or concepts in pairs or small groups. Teachers believed resources supported them
in evaluating pupil responses; a teacher in one lesson asked pupils for their
solutions irst, and then only after exploring all pupil solutions was the
teacher’s own solution offered. Wide participation in lessons was clearly an
important outcome for some pupils, particularly when games were used. As
Haldane (2007) commented: ‘Each pupil was moving the word with Martha, albeit cognitively and not physically’.
Societal implications
Certain societal aspects were introduced; teachers reported that having
more application to real life situations had had impact on their teaching,
and that video openers provided practical contexts for mathematics, which
was important for pupils if they were to see value in mathematics that was
wider and longer term, rather than just having immediate subject interest.
Additionally, a range of pupils recognized the value of activities that were
seen to ‘care for others’.
Conclusion
Many pupils reported that their enjoyment of mathematics had increased
since the beginning of Year 7, that they could learn new things in mathematics more easily than at the start of Year 7, that they enjoyed using digital
resources in mathematics lessons, that it was easier to remember things
when they used them, and that playing mathematical games helped them
58
Mathematics Education with Digital Technology
to remember things (although slightly fewer indicated that they enjoyed
playing mathematical games). Teachers used digital resources in ive ways
that were frequently reported by pupils as enhancing their engagement
with and understanding of mathematics: to enhance visual clarity; to clarify
a process; to develop conceptual understanding; to encourage participative
learning and to increase pace and variety. The extent of impact of these ive
elements was not quantiied by this study, and subsequent research could
more accurately identify more precise levels of impacts.
Some teachers reported that the focus of their lessons had changed as
a result of using digital resources; the focus had moved away from them
as teachers towards more of a focus on the resources they were using.
Some teachers felt digital resources enabled a more collaborative environment to emerge, where they were working with pupils to construct
problems and devise methods to solve them. These forms of focus were
moving teachers away, as one teacher said, from ‘what to teach’ to thinking about ‘how to teach’. Some teachers reported that digital resources
extended their teaching styles to incorporate more high-level discussion,
group work and linking different areas of the curriculum within real-life
contexts.
Pupils and teachers reported learning and teaching beneits when using
digital resources, although some elements and aspects of learning were
supported far more than others. The learning framework analysis identiied a range of learning aspects that were not supported through uses of
digital resources in this project. In terms of impact on attainment tests,
some pupils believed that it helped them with Standard Attainment Tasks
(4 pupils), and these pupils reported these responses prior to their results
being known. Although this study shows that digital resources can support learning at a wide level, the proof that these features then lead to
learning that can be assessed through examination procedures is yet to be
shown.
Acknowledgements
The author would like to thank Research Machines Education plc and the
Maestro Project for support of this independent research. Further details and
a summary report for teachers can be found at:
www.rm.com/Secondary/InTheNews/Article.asp?cref=MNEWS830586
www.rm.com/_RMVirtual/Media/Downloads/Final_Maestro_Project_
Paper.pdf
Learning Mathematics Using Digital Resources
59
References
Becta. (2001). The Secondary School of the Future – A Preliminary Report to the DfEE.
Coventry: Becta.
—(2003). Secondary Schools – ICT and Standards. An Analysis of National Data from
Ofsted and QCA. Coventry: Becta.
Bloom, B. (1956). Taxonomy of Educational Objectives. New York: Longmans.
Bransford, J. D., Brown, A. L. and Cocking, R. R. (eds) (2000). How People Learn:
Brain, Mind, Experience, and School. Washington, DC: National Academy Press.
Child, D. (1973). Psychology and the Teacher. London: Holt, Rinehart and Winston.
Cox, M., Abbott, C., Webb, M., Blakeley, B., Beauchamp, T. and Rhodes, V. (2003).
ICT and Attainment: A Review of the Research Literature. ICT in Schools Research and
Evaluation Series No. 17. Coventry/London: Becta/DfES.
Cox, M. J. (1997). The Effects of Information Technology on Students’ Motivation. London:
Kings’ College London and Coventry: NCET.
Denning, T. (1997). IT and Pupil Motivation: A Collaborative Study of Staff and Pupil
Attitudes and Experiences. Stoke-on-Trent: Keele University and Coventry: NCET.
Department for Education and Employment. (DfEE) (1999). The National Numeracy
Strategy: Framework for Teaching Mathematics from Reception to Year 6. London: DfEE.
Department for Education and Skills (DfES) (2006). ‘Thinking Skills web-pages, on
the National Curriculum pages’. www.nc.uk.net/LACcs_thinkskill.htlm).
(accessed on 6 November 2009)
Gardner, H. (1991). The Unschooled Mind: How Children Think, How Schools Should
Teach. New York: Basic Books.
Haldane, M. (2007). ‘Interactivity and the digital whiteboard: Weaving the fabric of
learning’. Learning, Media and Technology, 32 (3), 257–70.
Harrison C., Comber C., Fisher T., Haw K., Lewin C., Lunzer E., McFarlane A.,
Mavers D., Scrimshaw P., Somekh B., Watling R. (2002). ‘ImpaCT2: The impact
of information and communication technologies on pupil learning and attainment’. A report to the DfES. ICT in Schools Research and Evaluation Series
No.7. Coventry: Becta. www.becta.org.uk/research (accessed on 6 November
2009).
Higgins, S., Beauchamp, G. and Miller, D. (2007). ‘Reviewing the literature on interactive whiteboards’. Learning, Media and Technology, 32 (3), 213–25.
Kennewell, S. and Beauchamp, G. (2007). ‘The features of interactive whiteboards
and their inluence on learning’. Learning, Media and Technology, 32 (3), 227–41.
Kozma, R.B. (1994). The Inluence of Media on Learning: The Debate Continues. www.ala.
org/ala/aasl/aaslpubsandjournals/slmrb/editorschoiceb/infopower/selectkozmahtml.htm, (accessed on 23 September 2007).
Lave, J. and Wenger, E. (1991). Situated Learning: Legitimate Peripheral Participation.
New York: Cambridge University Press.
Lipman, M. (1995). ‘Caring as Thinking’. Inquiry: Critical Thinking across the Disciplines, 15 (1), 1–13.
Moseley, D., Baumield, V., Elliott, J., Higgins, S., Miller, J. and Newton, D. P. (2005).
Frameworks for Thinking: A Handbook for Teachers and Learning. Cambridge:
Cambridge University Press.
60
Mathematics Education with Digital Technology
Murphy, J. F., Jain, N. L., Spooner, S. A., Hassan S.W., Shnasse J. L., Metcalfe E. S.,
Schoening, P. A, Cunnius, E. L., and Frisse, M. E. (1995). ‘Use of an interactive
electronic whiteboard to teach clinical cardiology decision analysis to medical
students’. Journal of the American College of Cardiology, 25 (2), Supplement 1 238A.
Passey, D. (2006). ‘Technology enhancing learning: Analysing uses of information
and communication technologies by primary and secondary school pupils with
learning frameworks’. The Curriculum Journal, 17 (2), 139–66.
—(2008). ‘The Role of Mobile Technologies in Moving “Digital Natives” to “Learning Natives” ’. In J. Traxler, B. Riordan and C. Dennett (eds). Proceedings of the
mLearn2008 Conference ‘The Bridge From Text To Context’. Wolverhampton:
University of Wolverhampton School of Computing and Information
Technology.
Passey, D. and Rogers, C. with Machell, J. and McHugh, G. (2004). The Motivational
Effect of ICT on Pupils: A Department for Education and Skills Research Project
4RP/2002/050–3. Nottingham: DfES.
Presseisen, B.Z. (2001). ‘Thinking skills: Meanings and models revisited’. In
A. L. Costa (ed.) Developing Minds: A Resource Book for Teaching Thinking, third
edition, pp. 47–53. Alexandria, VA: ASCD Publications.
Smith, F., Hardman, F. and Higgins, S. (2006). ‘The impact of interactive whiteboards on teacher-pupil interaction in the national literacy and numeracy
strategies’. British Educational Research Journal, 32 (3), 443–57.
Twining. P. and McCormick R (1999). Learning Schools Programme: Developing Teachers’
Information Communication Technology Competence in the Support of Learning. Milton
Keynes: Open University.
Vygotsky, L. S. (1978). Mind in Society: The Development of the Higher Psychological
Processes. Cambridge, MA: Harvard University Press.
Wall, K., Higgins, S. and Smith, H. (2005). ‘ “The visual helps me understand the
complicated things”: pupil views of teaching and learning with interactive
whiteboards’. British Journal of Educational Technology, 36 (5), 851–67.
Chapter 7
Improving on Expectations: Preliminary
Results from Using Network-supported
Function-based Algebra
Walter Stroup, Lupita Carmona and Sarah M. Davis
The University of Texas at Austin, US
This chapter reports preliminary analyses comparing results on the stateadministered 8th grade and 9th grade algebra Texas Assessment of Knowledge and Skills (TAKS) for a treatment and a control group. The treatment
group consisted of 127 students from algebra classes at a highly diverse
school in central Texas taught by two relatively new teachers using a network-supported function-based algebra (NFBA) approach as integrated
with the ongoing use of an existing school-wide algebra curriculum. The
control group was comprised of 99 students taught by two more-senior
teachers in the same school using only the school-wide algebra curriculum.
The intervention consisted of implementing 20–25 class days’ worth of
NFBA materials over an 11-week period in the spring of 2005. Because the
students were not randomly assigned to the classes, the study is a
quasi-experimental design. Using a two sample paired t-Test for means,
statistically signiicant results for the treatment group (p-value one tail =
0.000335 > ␣ = 0.05) were obtained. We can conclude the NFBA intervention was effective in improving outcomes related to learning the algebra
objectives assessed on the 9th grade TAKS.
Introduction
To date, the multiple-strands based approach to curricula promoted by the
National Council Of Teachers of Mathematics (1989, 2000) has not displaced the single-strand Algebra I course as gatekeeper in the educational
62
Mathematics Education with Digital Technology
system of the United States. If anything, the standard, ‘standalone’, Algebra
I course is now even more central at many levels, including in state curricula (e.g., minimum course requirements and exit exams) and in nationally
administered tests (e.g., the new SAT tests). As a result, improving student
outcomes related to the content of the traditional Algebra I curriculum is,
perhaps, the single most strongly felt need relative to secondary mathematics education. Given the raised expectations regarding introductory algebra, we look to ask if there are ways of systematically improving on expected
student outcomes in ways that move beyond the current overemphasis on
addressing performance shortcomings with remediation. Our study looks
to move in this direction. As illustrated by the results for our control group,
past student performance on state-administered tests tends to be predictive
of future testing outcomes. In our effort to identify approaches that are
likely to improve expected student outcomes, not maintain them, we compared paired 8th and 9th grade TAKS results for the students in our study
and asked the question: Do the students in our treatment group outperformed their peers in the control group on the algebra objectives tested on
the state administered, 9th grade, TAKS? Did the NFBA intervention have
the effect of improving on expected student outcomes?
Our intervention centred on the use of function-based algebra (FBA) as
supported by generative activity design in a next-generation classroom
network technology (i.e., the TI-Navigator 2.0 network combined with
classroom sets of TI-84 Plus calculators). We call this approach networksupported function based algebra (NFBA). After providing some background
for our study we report our results. Because the students were not randomly
assigned, the study is based on a quasi-experimental design. Using a two sample paired t-Test for means, statistically signiicant results in outcomes for the
treatment group (p-value one tail = 0.000335 > ␣ = 0.05) were obtained.
Background
There are three strands of analysis that are brought together in framing our
study: (1) using FBA in a way that speaks more directly to the structural
aspects of a standard introductory algebra curriculum, (2) situating this
version of a function-based approach relative to generative activity design as
supported by the capabilities of next-generation classroom networks
(Stroup et al., 2005) and (3) explaining our use of performance on previous high stakes mathematics testing to evaluate the effectiveness of the
algebra-speciic interventions implemented for this study.
Improving on Expectations
63
Function-based Algebra Revisited – Emphasizing
Mathematical Structure
In ways that highlight the idea of function, affordable technologies such as
the graphing calculator have long been recognized to have the potential to
substantively alter the organization of teaching and learning algebra concepts. Indeed, a number of approaches to pursuing FBA are discussed in
the research literature (for an overview see Kaput, 1995). Many of these
approaches were developed as part of an ambitious, and still ongoing, effort
to fundamentally reorganize school-based mathematics to focus on modelling. For curricula, this would mean that the formal set-theoretical approaches
to deining function that had come to be associated with the ‘new math’
movement would be downplayed and largely replaced by an approach highlighting how functions can be used to model co-variation – that is, how one
variable is related to, or co-varies with, another variable. Computing technologies like the graphing calculator were to support signiicant engagement with, and movement between, representations of functions in symbolic,
tabular and graphical forms. Indeed a technology-supported engagement
with these ‘multiple representations’ of functional dependencies, especially
as situated in motivating ‘real world’ contexts, has come to typify both what
function-based algebra is and why function-based algebra it is expected to be effective with learners. In the United States this modelling-based approach to
FBA informed the development of the ‘standards-based’ mathematics curricula funded by the National Science Foundation and then incorporated
into various levels of ‘systemic reform’ initiative also supported by NSF.
These systemic reform initiatives, anticipating the language associated
with the more recent No Child Left Behind legislation, were to ‘raise the
bar’ and ‘close the gaps’ in student performance. The signiicance of this
modelling-focused alignment notwithstanding (e.g., the State Systemic
Initiative in Texas played a considerable role in the State-wide adoption of
graphing technologies for algebra instruction and assessment), in day-today practice a modelling-focused approach to FBA has fallen well short of
displacing much of what still constitutes the core of traditional algebra
instruction. In part, the feedback from educators seems to be that as powerful as ‘real world applications’ might be in motivating some students,
the ‘bottom line’ is that abstractions and formalisms are what continue to
be emphasized on standardized exams and thus are what teachers feel
considerable pressure to engage. Among school-based educators who are
feeling enormous pressure to improve testing outcomes, modelling-based
FBA is simply not seen as suficiently helpful in addressing the core
64
Mathematics Education with Digital Technology
‘structural’ topics of a standard algebra curriculum. In framing our study,
however, it is important to underscore that this perceived shortcoming is
not a limitation in the potential power of using a function-based approach,
but is only a limitation in a particular implementation of FBA that is, itself,
principally motivated by the goal of making modelling the overarching
focus of school-based mathematics (and far less by improving outcomes
related to learning introductory algebra). For our study we take the strong
position that while emphasizing modelling should continue to be important, a function-based approach also has enormous potential to improve
student understanding of the structural aspects of introductory algebra. To
make this point both with teachers and in our materials development, we
have found it helpful to advance the following deliberately provocative, but
still sincere, claim: When viewed through the lens of a larger sense of what FBA can
be, nearly 70 per cent of a standard introductory algebra curriculum centres on only
three big topics. These three big topics are: equivalence (of functions); equals
(as one kind of comparison of functions) and a systematic engagement with
aspects of the linear function. This approach, as it is to be investigated in this
study, builds on ideas associated with FBA introduced by Schwartz and
Yerushalmy (1992) (see also Kline, 1945).
A major strength of this more structurally-focused, FBA is that it allows
for consistent interpretations of both equivalence and equals in ways that students can use to understand the seeming ambush of ‘rules for simplifying’
and ‘rules for solving’ typically presented early-on in a standard algebra curriculum. If the expression x + x + 3 is equivalent to the expression 2x + 3,
then the function f(x) = x + x + 3 and the (simpliied) function g(x) = 2x + 3,
when assigned to Y1 and Y2 on the calculator, will have graphs that are
everywhere coincident. They will also have paired values in the tables that
are, for any values in the domain, the same. Students will say ‘the graphs’
are ‘on top of each other.’ This ‘everywhere the sameness’ associated with
equivalence then will be readily distinguished from equals, as just one kind
of comparison of functions. Equals comes to be associated with the value(s)
of the independent variable where the given functions intersect (and > is
associated with where one function is ‘above’ another; < where one is
‘below’). The students will understand from looking at the graphs that the
function f(x) = 2x and the function g(x) = x + 3 are clearly not equivalent
(they are not everywhere the same). But there is one value of x where these
functions will pair this x with the same y-value (the students will say there is
one place where the functions are ‘equal’ or ‘at the same value’). Graphically,
equals is represented as the intersection in a way that is quite general and that
readily extends beyond comparisons of linear functions (e.g., –x2 + 2x + 8 =
x2 – 4x + 4). This distinction between equivalence and equals is helpful
Improving on Expectations
65
because in a standard, non-function based, algebra curriculum rules for
simplifying expressions and rules for solving systems of equations are introduced very near each other and, not surprisingly, often become confounded. In addition students will feel like they have no ready way of
checking their results, other than asking the teacher. In marked contrast,
using a function-based approach, as supported by the use of a combined
graphing, tabular and symbolic technology like a graphing calculator,
students can readily ‘see’ the difference between these ideas and can use
these insights to make sense of results from ‘grouping like terms’ as distinct
from ‘doing the same thing to both sides’. This then allows the students to
test their own results, using the technology, for either simplifying or solving.
For simplifying they can ask themselves if the resulting simpliied function
is everywhere ‘the same’ as the given function? For solving systems of linear
equations they can ask did their attempts to ‘do the same thing’ to the linear
functions on both sides of the equation preserve the solution set (i.e., the
x-value at the intersection)? Having students be able to distinguish and
make sense of these two core topics in a standard algebra curriculum is
signiicant and illustrates the power of FBA to help with structural aspects of
a standard Algebra I curriculum. These ideas were emphasized in the
materials we developed. Of course, a modelling-oriented approach to FBA
can be helpful in supporting student understanding of the third of the big
three topics: a systematic engagement with aspects of the linear function.
But herein we want to continue to illustrate some elements of a less modelling centric engagement with FBA. As a result, we will illustrate implementing aspects of studying linear functions using generative activity design as
supported by new network technologies. The effectiveness of this structural
approach to FBA, without network capabilities, has begun to be established
(cf., Brawner, 2001). We now move on to consider the role new network
technologies can have in further enhancing FBA.
Supporting Generative Design with TI-Navigator TM 2.0
Briely, generative design (cf. Stroup et al., 2005) centres on taking tasks
that typically converge to one outcome, for example, ‘simplify 2x + 3x’, and
turning them into tasks where students can create a space of responses, for
example, ‘create functions that are the same as f(x) = 5x’. The same ‘content’ is engaged for these two examples, but with generative design a ‘space’
of diverse ways for students to participate is opened up, and the teacher,
based on the responses, can get a ‘snapshot’ of current student understanding (so, for example, if none of the functions the students create to be same
66
Mathematics Education with Digital Technology
as f(x) = 5x involve the use of negative terms, the teacher can see in real
time that students may not be conident with negative terms and can use
this information to adjust the direction of the class). To illustrate how generative design and NFBA can help with the third of the three core topics in
a standard algebra curriculum, we’ll briely sketch some of the activities we
used in our intervention. The Navigator TM 2.0 system allows students to
move an individual point around on his/her calculator screen and also
have the movement of this point, along with the points from all the other
students, be projected in front of the class. In one introductory activity students are asked to ‘move to a place on the calculator screen where the
y-value is two times the x-value’. There are many places the students can
move to in satisfying this rule, and this is what makes the task generative.
Often the majority of the points are located in the irst quadrant and this
gives the teacher some sense of where the students are in terms of conidence with negative x- and y-values. This exploration of a rule for pairing
points does describe a function and this approach to creating functions is
not dependent on co-variation (indeed, should the teacher want to discuss
it, this activity can be used to highlight a set-theoretic approach to deining
a function). After observing that ‘a line’ forms in the upfront space, all the
points then can be sent back to the students’ calculators and can act as ‘targets’ for creating different functions on their calculators (in Y1= , Y2 =, etc.)
that include (‘go through’) these points. Then the students can send up
what they consider their ‘most interesting’ functions. A space of often quite
interesting equivalent expressions is thereby created and shared in the
upfront-space. To further explore ideas related to linear functions, students
also can be given a rule like ‘move to a place where your x-value plus your
y-value add up to 2’. Again a ‘line’ forms but now when the points are sent
back to calculators, the students are pushed to explore ideas related to moving from a linear function in standard form (i.e., x and y summing to 2) to
the same function being expressed in slope-intercept form (the form the
students must use on the calculators in order to send a function through
the points). Again, these and many other structural ideas found in a standard algebra curriculum can be explored using NFBA.
Improving on Expectations
As is mentioned earlier, the intent of the ‘No Child Left Behind’ legislation in the United States is to ‘raise the bar’ of what is expected of all
students and to ‘close the gaps’ in performance of currently underserved
Improving on Expectations
67
populations. The effort is to be forward looking as higher expectations
and measurable progress are to present a tight system of positive feedback
in driving demonstrable improvement in educational outcome. Even in a
time of heightened political partisanship in the United States, this vision
is still seen as compelling and potentially unifying. But as systems theorists
(cf., Senge, 1994) are quick to remind us, a challenge in implementing
major structural reforms is ensuring that the intended dynamics meant to
both characterize and drive the change – in this case positive forms of
feedback between raised expectations and measurable outcomes – are not
themselves overwhelmed by unanticipated and unintended consequences
of what may be well-intending implementation. Relative to learning algebra, one widely used strategy is to preserve the current approaches to
teaching algebra and then address shortcomings in student outcomes
with remediation. The problem is that remediation, almost by deinition,
is an inherently backward looking and corrective strategy. Its role is to ix
what is seen as broken, not to drive forward progress. Relative to mathematics education, with more and more effort at each grade level (especially in underperforming schools but also in lower ‘tracks’ in higher
performing schools) spent on correcting for past or anticipated shortcomings (e.g., ‘reviewing’ material not mastered from previous years,
funding remediation classes during the school year and/or in the summer, or spending considerable class time practicing test-taking skills)
attention to proactive strategies (strategies that improve on expected outcomes) is being compromised. From a structural point of view a positive
feedback loop – like that between raised expectations and measurable
progress found at the heart of the NCLB legislation – needs practical forward looking and forward acting strategies to be effective. To make the case
for NFBA being an example of one such strategy, we look to compare our
treatment group outcomes on the 9th grade TAKS™ algebra objectives
relative to what might be expected based on previous performances on
the 8th grade TAKS.
The Study
Research Question
Does the network-supported function-based approach outlined above
improve the performance of the treatment group in statistically signiicant
ways relative to the performance of control group peers?
68
Mathematics Education with Digital Technology
The Sample
The study participants were 226 students from a diverse high school in central Texas. All the students were enrolled in ‘non-repeater’ (non-remedial)
sections of Algebra I and nearly all the students were in 9th grade. Two relatively junior teachers were assigned by the department chair to the experimental group and two more-experienced teachers were assigned to the
control group: 127 students were in the treatment group and 99 students
were in the control group.
Activities
In their Algebra I class, the treatment groups used a NFBA over 9 weeks of
instruction in the spring of 2005. The treatment and control groups kept
their curricula on the same topics but the experimental group used the
NFBA materials, on average, approximately 2 days a week.
Methods
The raw 8th and 9th grade scores for the State-administered TAKS tests
were obtained for the students participating in the study. The 8th grade
TAKS was taken before the intervention and the 9th grade TAKS scores for
the algebra objectives were collected after the intervention.
Analyses
The raw scores on the 8th grade TAKS and the algebra items on the 9th
grade TAKS were converted to per cent correct results. Table 7.1 and
Figure 7.1 show the comparison of the means for the 8th and 9th grade
TAKS for the treatment and control groups.
Table 7.1 Mean TAKS Score Results for Treatment and
Control Groups
Treatment
Control
8th GRADE TAKS SCORES
53.8
56.4
9th GRADE TAKS SCORES (Algebra Items)
57.9
56.1
Improving on Expectations
69
MEANS COMPARISION BETWEEN
8th AND 9th GRADE TAKS
62
60
58
Mean Treatment
Mean Control
56
54
52
50
48
46
TAKS 8th Grade
TAKS 9th Grade
Assessments
Figure 7.1
Means Comparison of TAKS Results
We implemented two approaches to study changes attributable to the intervention: (1) comparing the student performances between the treatment
and control groups irst before the intervention (8th grade TAKS) and then
after the intervention (9th grade TAKS for Algebra Items) (2) comparing
the paired student performances before and after the intervention for the
control group and then the treatment group.
First Comparison
Our irst approach was to carry out a comparison between Treatment and
Control group results, irst before and then after the intervention.
No statistical difference was found between treatment and control groups’
results either before or after the intervention. The graph in Figure 7.1,
however, suggests a need for additional analyses. On the graph it is clear
that, although no statistically signiicant differences were found using the
given methods, the treatment group started off about 2 per cent lower than
the control group on the average 8th grade TAKS scores. Then after the
intervention the plot of the 9th grade results shows that the students in the
control group maintained almost the same average on the 9th grade TAKS
score (the dotted line is almost completely horizontal, showing no change)
70
Mathematics Education with Digital Technology
whereas the treatment group’s graph shows appreciable improvement,
approximately 4 per cent. This suggests the possibility of comparing paired
scores before and after intervention, for the control and the treatment
groups separately, using a two-sample paired t-Test for the means.
Second Comparison
Our second approach was to carry out a comparison of Paired TAKS Scores
before and after intervention for the Control Group and then for the Treatment Group.
We performed a two sample paired t-test for means for the control group to
look for changes in TAKS scores before and after intervention. As might be
suspected from examining graph for the control group in Figure 7.1, the
results of the t-test show no evidence that the means for the control group
before and after the intervention are different (p-value one tail = 0.402 >
␣ = 0.05). As a result we can conclude that the students in the control group
maintained consistent averages for the 8th grade and 9th grade algebra
TAKS scores. There was no statistically signiicant improvement. This result
is consistent with the sense that absent changes in practice, performance in
one year is likely to predictive of performance in the next. When we implemented a two sample paired t-test for the means for the treatment group,
the results (p-value one tail = 0.000335 > ␣ = 0.05) provided strong evidence
of differences in means before and after intervention. This suggests the
students in the treatment group improved signiicantly in paired results on
the 8th and 9th grade TAKS. Considering that the treatment and control
groups were comparable, that no improvement was shown for the paired
8th and 9th grade TAKS scores in the control group, and that improvement
was shown for the paired 8th and 9th grade TAKS scores in the treatment
group, we have strong evidence to say that this improvement in TAKS scores
was an effect of the intervention. NFBA does appear to have been proactively effective in improving student outcomes.
References
Brawner, B. F. (2001). ‘A function-based approach to algebra: Its effects on the
achievement and understanding of academically-disadvantaged students’.
Unpublished doctoral dissertation, The University of Texas at Austin.
Kaput, J. J. (1995). ‘A research base supporting long term algebra reform?’ In
D. T. Owens, M.K.Reed and G.M.Millsaps (eds), Proceedings of the Seventeenth
Improving on Expectations
71
Annual Meeting of the North American Chapter of the International Group for the Psychology of Mathematics Education, vol. 1, pp. 71–94. Columbus, OH: ERIC Clearinghouse
for Science, Mathematics, and Environmental Education. (ERIC Document
Reproduction Service No. ED 389 539).
Klein, F. (1945). Elementary Mathematics from an Advanced Stand-point: Arithmetic,
Algebra, Analysis. New York: Dover.
Schwartz, J. and Yerushalmy, M. (1992). ‘Getting students to function in and with
algebra’. In G. Harel and E. Dubinsky (eds), The Concept of Function: Aspects of
Epistemology and Pedagogy. MAA Notes, 25, pp. 261–89. Washington, DC: Mathematical Association of America.
Senge, P. M. (1994). The Fifth Discipline: The Art and Practice of the Learning Organization. New York: Doubleday.
Stroup, W. M., Ares, N. and Hurford, A. (2005). ‘A dialectic analysis of generativity:
Issues of network supported design in mathematics and science’. Journal of Mathematical Thinking and Learning, 7 (3), 181–206.
Stroup, W. M., Carmona, L. and Davis, S. (2005). ‘Improving on Expectations:
Preliminary Results from Using Network-Supported Function-Based Algebra’. In
S. Wilson (ed.), Proceedings of 27th Annual Meeting of the Psychology of Mathematics Education – North American Chapter, Blacksburg, VA.
TAKS is a trademark of the Texas Education Association.
TI-Navigator is a trademark of Texas Instruments Incorporated.
Part Three
Key Pedagogical Issues in
Embedding ICT in Teaching
and Learning Mathematics
One of the issues for teachers when using technology in the classroom is
that of ensuring that the time invested in learning to use a digital tool,
whether by the teacher or pupils, pays dividends in terms of enhancing
learning. Moving away from the short-lived motivational beneits of using
something new, in this chapter, authors relect on the ways in which Information and Communications Technology (ICT) can truly contribute to
learning. Colette Laborde considers the nature of tasks and problems for
which dynamic geometry software is inherently useful and how learners can
beneit from using it. John Mason writes about the use of manipulatives and
how users can meaningfully interact with them. He contemplates the different levels of engagement and sophistication involved in experiencing and
being convinced by phenomena, justifying them and using tools to recreate
them. Rosemary Deaney and Sara Hennessy present their indings from a
case study in which a teacher utilized a range of pedagogical strategies to
capitalize on the opportunities afforded by different digital tools. It is interesting to consider how some of the strategies employed by the teacher in
Deaney and Hennessy’s study relate to the ‘levels’ of engagement with
manipulatives discussed by Mason.
Chapter 8
Designing Substantial Tasks to
Utilize ICT in Mathematics Lessons
Colette Laborde
University Joseph Fourier and IUFM of Grenoble, France
Introduction
The design of tasks is a complex activity involving many dimensions. Most
of the time, mathematics teachers do not design tasks from scratch. They
choose tasks from textbooks or from available resources and may adapt
them to function, taking into consideration the variables in each classroom
set up (tasks already carried out, students’ available knowledge, notions
already known . . . ). When tasks are technology based, the situation is even
more complex, as adding technology deeply affects the task itself. A task
planned for paper and pencil cannot simply be applied to that done with
technology with unchanged learning aims. It is well known that some paper
and pencil problematic tasks may become trivial when solved with technology, such as obtaining the graph of a function in a default window on a
graphic calculator. Conversely technology offers affordances for new kinds
of tasks not possible in paper and pencil environments speciically designed
for fostering learning.
In a past research and development project (Laborde 2001) in which a
group of teachers wrote teaching scenarios based on Cabri for high school,
we could distinguish four kinds of tasks making use of Cabri and observe
how tasks designed by teachers evolved over time.
New Kinds of Tasks Made Possible by Technology
Four kinds of tasks among tasks designed by several teachers integrating
Cabri in their teaching at high school were distinguished:
76
Mathematics Education with Digital Technology
– tasks in which the environment facilitates the material actions but does
not change the task for the students, for example, producing igures and
measuring their elements;
– tasks in which the environment facilitates students’ exploration and
analysis, for example, identifying relations within a igure through dragging. A polygon and its translated image are given in Cabri. Students are
asked to conjecture relations between the sides of the initial polygon and
its image. In this kind of task, a visual recognition of the relations should
be relatively easy. The role of Cabri is to help students make conjectures
about the relations using the drag mode;
– tasks that have a paper and pencil counterpart but can be solved
differently in the environment, for example a construction task may be
solved in dynamic geometry environment by using a geometric
transformation;
– tasks that cannot be posed without the mediation of the environment,
for example, reconstructing a dynamic diagram through experimenting
with it in order to identify its properties. A task like reconstructing a
dynamic diagram given in Cabri (so called ‘black box’ tasks) takes its
meaning from the Cabri environment itself, in particular from the drag
mode which preserves geometrical relations. Such tasks require identifying geometrical properties as spatial invariants in the drag mode and
possibly performing experiments with the tools of Cabri on the
diagram.
Let us illustrate more in detail each kind of task with examples in the
dynamic geometry environment Cabri for plane geometry (Cabri II Plus)
or 3D geometry (Cabri 3D).
An Example of an Unchanged Task: The Sum of the Distance of
a Variable Point to Fixed Points
Students were asked to construct the igure displayed below (Figure 8.1), in
which P is a variable point of segment AB. They were asked to measure PC
and PD for several values of AP and then to study, in the paper and pencil
environment as normal, the function PC+PD by making a table of values
and drawing the graph. The teacher did not mention the possibility of
obtaining this graph with Cabri as a locus which was a good reason to
connect geometry with calculus.
Designing Tasks to Utilize ICT
77
C
6.6 cm
D
3.7 cm
A
Figure 8.1
5.1 cm
P
B
Using Cabri for Easy Providing of Data
In this task, the software was mainly used as a provider of data. It was neither
the source of the tasks given to the students, nor part of the solving process of
these tasks that were intended to be solved without the computer.
An Example of a Task with Possible Change in the Solving Process
In Cabri3D like environments, there are new strategies based on breaking
down the cube into 2D elements. A lateral square can be considered as the
image of the base in a rotation with axis the edge of the base plane
(Figure 8.2). The other lateral faces can be obtained as images of the previous one in rotations around the vertical axis of the cube (Figure 8.3). Those
strategies are not spontaneously used by students. We hypothesize that the
construction strategies learned in 2D geometry become obstacles to new
strategies speciic of 3D.
We consider these strategies which are made possible by Cabri3D as interesting from a learning point of view, for two reasons:
– they enlarge the scope of possible ways of structuring the cube
– and they use construction tools based on objects and properties of 3D
geometry and as such contribute to the learning of 3D geometry.
In a paper and pencil geometry, these objects and properties are not operational for construction tasks, they are only operational in proofs. The
strength of Cabri3D like environments is that those objects and properties
become operational construction tools. They can be used in action in
construction tasks before being used at the level of proof. In construction
78
Mathematics Education with Digital Technology
Figure 8.2
A lateral face as rotated from the initial square
Figure 8.3
The second lateral face as rotated from the previous one
tasks, students can observe that these strategies provide the expected result.
The visual feedback strengthens the power of these properties.
Very relevant and beautiful examples of original and eficient instrumentation of Cabri3D are provided by Chuan (2006)1. They come from
the lecture given by Chuan at ATCM2 2006 entitled ‘Some unmotivated
Cabri3D constructions’. ‘Unmotivated’ was explained by Chuan as ‘non
algebra, non routine, not found in Euclid, discovered accidentally, tailor
made, so short, so beautiful, so fun’. These constructions are non-routine
and not found in Euclid because the tools they required were not
available. Chuan insists on the eficiency of the constructions (‘short’).
This is a critical feature of problems that are able to promote learning of
new knowledge according to the theory of didactic situations (Brousseau
Designing Tasks to Utilize ICT
79
1997). A new solving strategy is likely to be constructed by an individual
when his/her routine or available strategies are tedious or inoperative
for the problem. The beauty of the solution emerges from the conjunction of its eficiency and its unusual character. Let us comment one of the
examples given by Chuan: the triangular cupola starting from a hexagon
(Figure 8.4).
Constructing the cupola requires analyzing it. The base of the cupola is a
given regular hexagon and the top is an equilateral triangle. How to
determine the distance of this triangle to the base plane? Actually the vertices of the triangle are vertices of regular tetrahedra (Figure 8.5). In this
example, a regular tetrahedron is used as measurement transfer tool. This
solution is based on a deconstruction of the cupola into 3D and 2D
components of the igure.
Figure 8.4
A Triangular Cupola
Figure 8.5
Regular Tetrahedra Providing the Top of the Cupola
80
Mathematics Education with Digital Technology
An Example of a Task Only Existing in
a Dynamic Geometry Environment
Students are given a plane and its equation in Cabri 3D (Figure 8.6). They
can observe that, when moving a point deining the plane, this latter varies
as well as its equation. A point P with displayed coordinates not belonging
to the plane is given. Then the plane and all its points are hidden and
students are asked to move point P in order to put it as close as possible to
the hidden plane (Figure 8.7). Of course students must solve the task with
the plane remaining hidden.
−1.1x − 2.8y −0.7z = 10
P
(−2.9, 2.7, 5.2)
Figure 8.6
Plane and its equation
−1.1xp −2.7yp −0.7zp −10 = −9.77
P
Figure 8.7
−1.1x −2.8y −0.7z =10
(−2.0, −0.6, −5.2)
The plane is hidden; point P is moved until the expression equals 0
Designing Tasks to Utilize ICT
81
Solving this task requires using the equation of the plane in absence of a
spatial representation (Figure 8.7). Algebra is the only way to control the
position of the point with respect to the plane. This is exactly why the task
is interesting for understanding that the value of the equation instantiated
with the value of the coordinates of P allows the students to know whether
the point is on the plane, very close to the plane or not. Obviously this task
can only be given in a dynamic environment in which geometric and algebraic representations are linked.
Such tasks given in dynamic geometry environments can contribute to
learning for two reasons:
z
z
the task itself and its demands
the feedback given by the environment to the students’ actions and in
particular when dragging, the students may observe the effects of their
construction in the environment, whether it is preserved by drag mode
or not, whether it behaves as expected or not.
Evolution of the Tasks of the Scenarios Over Time
Tasks of the irst category were found only in the scenarios written by a
teacher who was a novice at teaching but an expert in the use of technology:
they were tasks in which Cabri was facilitating the collection of numerical
data.
We also observed an evolution over time in the type of tasks proposed by
experienced teachers. The irst and second versions of their scenarios did
not mainly comprise tasks that cannot be posed outside of the environment.
It is easy to understand that the design of such tasks represents a conceptual
break with the usual tasks performed in a paper and pencil environment. It
is easier to discover new eficient strategies available in Cabri in an existing
task than to invent new tasks. We could observe an evolution over time in
the frequency of occurrence of the types of tasks. At the beginning, most
were observation tasks for conjecturing, whereas more different tasks
appeared in later versions.
From the very beginning of the writing of scenarios, the experienced
teachers in both domains teaching and Cabri often used the observation
tasks in which Cabri facilitated the production of conjectures. They
expressed clearly that for them the role of the software is to save time, to
avoid complex constructions requiring the use of properties that are exactly
the properties to be discovered and to favour visualization. The declared
intention of the teachers was to keep the demands of the task at a modest
82
Mathematics Education with Digital Technology
level. The role of Cabri was mainly to facilitate conjecturing and not to
cause a problem, as in construction tasks, where the solving strategies have
to be constructed with the Cabri tools.
At the beginning of the project, the experienced teachers also used
construction tasks but less frequently. And inally, inluenced by the
researchers, they introduced a geometrical transformation as a black box
task: students had to ind out how the image of a point could be constructed
from its pre-image.
Multiple Dimensions Involved in the Design of Tasks
From this project, we could infer that the design of task resorting to dynamic
geometry and aimed at fostering learning must be based on questions of a
varied nature:
– epistemological questions: Is there a real problem to be solved? What kind
of mathematical knowledge does require the solving of the task with technology? Is the most eficient solving strategy in the environment based on
mathematical knowledge which is aimed by the task?
– cognitive questions: What kind of learning does promote the task? This
analysis must be done by taking into account students former knowledge
and conceptions.
– didactic questions: What are the means of action provided by the environment for solving the task? Are the values of the variables of the task
chosen in order to promote the desired strategies? Is there feedback
from the environment for invalidating wrong strategies? This is
particularly important in dynamic geometry environments in which
dragging offers feedback.
– instrumental questions: What do students know about how to use the
environment to solve the task? Will their mathematical knowledge allow
them to solve the task by using tools of the environment they are not
familiar with or conversely can they build a new solving strategy capitalizing on their familiarity with the environment?
Conclusion
These questions are presented separately for clarity reasons but they are
clearly intertwined. Assude (2007) calls instrumental integration the way
instrumental and mathematical dimensions are organized and related to each
Designing Tasks to Utilize ICT
83
other by the teacher when giving tasks to students. From observations of teachers, she concludes to the high level of expertise required by coordinating both
mathematical and instrumental dimensions. Such an expertise is far from
being spontaneous and pre-service as well as in-service teacher education can
certainly play a critical role in the development of such an expertise.
Notes
1
2
At the address sylvester.math.nthu.edu.tw/ d2/talk-atcm2006-unmotivated/
Asian Technology Conference in Mathematics, http://landau.ma.polyu.edu.hk/
atcm/
References
Assude T. (2007). ‘Teachers’s practices and degree of ICT integration’. In Proceedings of CERME 5 (5th Conference of the European Society for Research in
Mathematics Education) 1339–1348. http;//ermeweb.free.fr/Cerme5.pdf
(accessed on 10 November 2010)
Brousseau, G. (1997). Theory of Didactical Situations in Mathematics. N. Balacheff,
M. Cooper, R. Sutherland and V. Warield (trans and eds). Dordrecht, The
Netherlands: Kluwer Academic Publishers.
Laborde, C. (2001) ‘Integration of technology in the design of geometry tasks with
Cabri-geometry’. International Journal of Computers for Mathematical Learning 6,
283–317.
Chapter 9
Learning from Acting on Objects
John Mason
Open University and University of Oxford, UK
Introduction
This chapter brings a collection of psychological and pedagogical constructs to bear on the use of physical and virtual objects with which learners
can interact in order to learn mathematics. Plato commended Egyptian use
of simple apparatus for learning about number, and ever since the irst
HMI reports in the mid-nineteenth century, people have advocated use of
pedagogic apparatus in secondary schools as well as in primary schools, but
with little success. This is entirely consistent with a modern perspective of
structural relations between actions on objects as being the stuff that mathematics formalizes and studies. Consequently electronic screens appear to
provide an even richer array of virtual objects through which to display
phenomena and to enable learners to act. Applying elaborations of Bruner’s three modes of (re)presentation (enactive, iconic, and symbolic) seen as
three worlds in which learners act, which currently provides a strong theoretical basis for structuring teaching, and applying his work with colleagues
on Vygotsky’s notion of scaffolding, augmented by the equally necessary
component of fading, leads to some sharp questions about whether opportunities to manipulate virtual objects can ever be suficient to ensure
learning.
This chapter suggests that in order to learn from analysing phenomena
and acting on objects it is necessary to do more than experience those
phenomena and those actions. To learn from the experience it is necessary
to withdraw from the action and to become aware of the effects of those
actions as phenomena, including considering which actions are more or
less effective in different situations, and of how structural relationships can
be perceived as properties that can apply in other situations.
Acting on Objects
85
Background
Information and Communications Technology (ICT) brings powerful tools
into the hands of anyone who cares to access them. Drag & Drop, Fill-Right
and Fill-Down, and simply Drag-to-Vary are powerful actions that can only
be imagined in physical situations or when staring at a single diagram or
collection of symbols on paper. ICT could therefore be expected to transform not only the teaching and learning of mathematics, but the very nature
of mathematics as it is experienced in school and university. But does it?
Will it? The track record so far is at best patchy, and research in several
countries suggests that mathematics teachers are often among the least
committed users of ICT in classrooms.
On the one hand, we have Mathematica and Wolfram’s New Science (Wolfram, 2002) as but one representative of increasingly sophisticated mathematical software, and we have experimental mathematics as promoted by
Jonathan Borwein (Bailey et al., 2007)) among others. On the other hand,
we have the conservative forces of curriculum policy makers and politicians,
together with the massive inertia of the institution of school mathematics.
This inertia is due to the effort required in interacting with learners in new
ways and on new topics that may be unfamiliar both to teachers and to
learners.
Mathematics, especially in school and university, can be seen as ways of
explaining and predicting phenomena through appreciating underlying
structural relationships. These phenomena can be chosen to expose relationships that require both scoping and justiication: Under what conditions might they hold, and why must they hold? Whereas phenomena in the
material world such as movements of doors and diggers, uses of circles as
manhole covers, sagging of overhead cables, forces on Frisbees, rolling of
paper cups on loors, trajectories of fountains, scaling of maps and a wealth
of other multiplicative relationships can be very complicated to disentangle, virtual phenomena can be constructed to focus attention on speciic
structural relationships that can be captured mathematically.
At its heart, mathematics concerns actions on objects, in a spiral of action
becoming object to be acted upon. Thus numbers arise from the act of
counting, arithmetic acts on numbers; arithmetic operations are special
cases of functions which are actions on numbers that give rise to extended
numbers such as rationals, reals, complexes and beyond; actions on functions leads to derivatives and integrals, transforms and functionals, and so
on, in an apparently endless cycle. Phenomena with which the individual
can interact can be explored, and relevant mathematical concepts can be
86
Mathematics Education with Digital Technology
experienced, through performing actions on objects. The objects may be
material (using Pythagoras to ensure a right-angle, using string to locate
altitudes of triangles) but are more likely to be conceptual leading to
arithmetic and algebra. Electronic screens offer the prospect of an everextending rich array of domains in which mathematical actions can be
performed and experienced.
Theoretical Underpinnings
Jerome Bruner (1966) famously proposed three modes of (re)presentation1 in human experience, which he called enactive, iconic and symbolic.
Enactive (re)presentation meant for him the use of physical objects, but it
can usefully be extended to refer to anything which is conidently manipulable by learners. An iconic (re)presentation is for him a diagram or image
that ‘looks like’ what it (re)presents, and so is likely to be correctly interpretable in a relatively wide community. By contrast a symbolic (re)presentation is purely conventional and independent of the thing being (re)
presented. In other words, to make sense of a symbolic (re)presentation
you need to be told what it signiies.
Of course the same object can be enactive for some people, iconic for
others, and symbolic for yet others, or perhaps can be treated in any of
these three modes. For example, to someone competent with algebra, an x
suggests an as-yet-unknown and is conidently manipulable and hence
enactive, whereas for most people it is an icon for ‘that topic called algebra
that I never understood’, and entirely symbolic in its abstruseness (Mason
1980). One consequence of this extension of Bruner’s distinctions is that
the form of (re)presentation depends on the learner. Thus, a secondary
student competent at basic arithmetic treats numerals as objects, whereas
most pre-school children experience them as symbols. When symbols
become conidently manipulable and meaningful, they lose their ‘symbolic’
qualities and become enactive elements for further manipulation.
Like Plato, Bruner recommended getting children working enactively
with physical objects. He went further though and recommended getting
them to use picture-diagrams to (re)present those actions while the objects
themselves might remain in view but out of reach, although if signiicant
dificulties were encountered the apparatus could be retrieved; and inally,
getting children to work with symbols standing for those objects, with access
to mental images of actions performed previously and to physical enactments. These transitions together constitute a form of scaffolding, which is
Acting on Objects
87
gradually withdrawn in order to encourage and foster movement to the
symbolic (Brown et al., 1989, Love and Mason 1992).
In trying to support mathematics teaching at primary and secondary
level, the Centre for Mathematics Education at the Open University (1981,
see also Mason and Johnston-Wilder 2004) augmented Bruner’s ideas in
the form of two further frameworks or labels for distinctions:
Manipulating – Getting-a-sense-of – Articulating
was intended to act as a reminder that the point of manipulating anything
was not simply to get answers, but to develop over time a sense of underlying
structural relationships which, when gradually brought to articulation, and
reined could become conidently manipulable objects in their own right.
This trio was seen as a form of helix so that when some dificulty arises it is
possible to backtrack down the helix to something more conidence inspiring so as to then make sense of the situation. Once conidently manipulable
objects are involved, learners can work their way back up the spiral at a pace
and in a manner suitable to them. The helix was combined with
Do – Talk – Record
as a reminder not to push learners too quickly to written records before
they have had a chance to do things (enactively) and to talk about what they
were doing, not just as an informal chat but involving increasingly succinct
and eficient use of technical terms. It was also pointed out that talking can
inform doing as well as recording, and attempting to record can inform
both doing and talking about what is being done. These were related to
mathematical processes or powers that learners possess based on distinctions made by George Pólya (1962; see also Mason et al., 1982).
Finally, the notion of scaffolding and fading was independently reconstructed as
Directed – Prompted – Spontaneous
as a reminder of the importance of moving from giving learners speciic
instructions as to what to do, to increasingly indirect prompts so that learners begin to integrate the actions into their available functioning so that
eventually they are able to act spontaneously for themselves. This instantiates
Vygotsky’s notion of the Zone of Proximal Development which is the collection
of actions that learners can already carry out when cued, and are on the
edge of being able to initiate and carry out for themselves (van de Veer and
Valsiner 1991, Mason et al., 2007).
88
Mathematics Education with Digital Technology
Bruner’s trio provides the basic theoretical justiication for many current
pedagogical practices, particularly in primary school, while the additional
frameworks, when internalized by teachers in any phase of education, provide reminders of choices of action and justiications for those actions when
planning for or in the midst of a lesson.
Examples
I shall consider two examples of mathematical phenomena to illustrate the
issues arising from the use of ICT in classrooms. Neither are oficially part of
the school curriculum, yet the irst is accessible to upper primary and secondary pupils as a phenomenon, and the second is accessible for exploring.
Example one: Actions on a Line
I consider this to be one of the most amazing geometrical phenomena,
certainly among those involving only straight lines.
Take any three points A, B and C on a line, (for the time being take C not
to be the mid-point of AB). Now let P be any point in the plane not on the
line ABC. Denote by Pc any point other than P or C on the line PC. Form the
lines A Pc and B Pc and where they cross the lines PB and PA respectively,
denote the points by Pa and Pb. Finally, let D be the point where the line Pa
Pb meets the line through ABC. The amazing fact is that D is independent
of the choice of P and the choice of Pc.
The principal phenomenon of interest is the wide range of freedom of
the points P and Pc and yet the point D remains invariant. This can be experienced using dynamic geometry software in which P and Pc can be dragged
about the plane while the point D fails to move, and that this holds for any
relative positions of A, B, and C (when C is the mid-point of AB, the line Pa
Acting on Objects
89
Pb is parallel to the line AB). The enactive aspect is the dragging of points;
the structural relationship is the invariance of the point D. It turns out that
there is a special relationship concerning signed distances along the line:
AC
CB = ⫺1
AD
DB
which is a ratio of ratios. It is intriguing that a relationship concerning four
distances along a line should be manifested by intersections of lines in a
higher dimension.
There are further relationships without even involving the point D. For
example, considering ratios of lengths of segments, it turns out that
PPa PPb PPc
+
=
Pa A Pb B PcC
which provides a geometric method for adding ratios. Also
1 sin(BPcC )
1
1 sin( APcC )
=
+
CPc APa sin( APa B) BPb sin(BPb A)
which, when P goes to ininity in any direction, yields the harmonic sum
1
1
1
⫽
⫹
CPc
APa BPb
associated with the crossed ladders and two-courier problems of medieval
arithmetic (Dagomari 1339, see Smith 1908). For example,
From Noemberg to Rome are 140 miles: A Traveller sets out at the same
Time from each of the two Cities, one goes 8 Miles a Day, the other 6: In
how many Days from their irst setting out will they meet one another,
and how many Miles did each of them go? (Hill 1745, p. 365)
Graphing the two journeys, and then rotating the graph through 90° produces a ‘crossed-ladders’ diagram which has the property that the sum of
the reciprocals of the heights of the two ladders is the reciprocal of the
height where they cross.
Here the enactive elements are much harder to ‘see’ and manipulate,
and very hard to experience bodily because they involve multiplicative relationships. The ratio of two ratios is hard to experience enactively, until the
diagram becomes a conidently manipulable entity for expressing the ratio
90
Mathematics Education with Digital Technology
of ratios! Use of measurements to indicate invariant ratios is much less convincing than physical embodiment, based as they are on approximate
measurements by computer. The third relationship admittedly uses trigonometry, but the connection to classic word-problems is remarkable.
Example 2: Polydials
Polydials is software still under development, but it illustrates some of the
potential as well as some of the obstacles of pedagogic software. Available to
the user are dials with various alterable whole numbers of ‘hours’ marked on
them. Also available are buttons used to advance the hands by a single ‘hour’
of one or more clocks simultaneously. Pictured below is a pair of clocks, one
with 6 ‘hours’ and one with 10, together with a button that advances both
simultaneously. The second igure shows the result of 7 clicks
An immediate question is how many clicks of the button will be required to
get both the dials back to the 0 position again, and what relative positions
are possible for the two dials. This question in some sense abstracts numerous situations in which two things are happening at different rates, such as
two wheels of different diameters on a vehicle, or two people walking at different rates or using different pace-lengths and so on.
91
Acting on Objects
A more challenging situation arises when there are more dials and more
buttons.
One task might be to try to get all the dials reading the same speciic
‘hour’ such as 1. An alternative version is to start with the dials in some nonzero positions and then try to get them all back to 0 again simultaneously.
Each button advances only the shaded dials in its icon.
It is worth noting that the button ‘labels’ are icons chosen to indicate
‘what they do’. The question is then how many pushes of each will achieve
some stated goal. Now there are two possibilities: empirical exploration (by
pushing buttons, at irst almost at random, then increasingly systematically
or with structural intent) and theoretical analysis (by expressing underlying
structural relationships as properties).
Let the button icons also be used to stand for the number of pushes
required to reach a particular goal, say all dials pointing to 1. Then because
the order in which you push buttons to advance the hands does not matter,
the following ‘equations’ express the desired relationships.
+
= 1 + 6s where s is some integer,
since these are the two buttons that effect the 6-dial, and any extra multiple
of 6 pushes leaves the dial in the same place.
+
= 1 + 4t where t is some integer
+
= 1 + 10u where u is some integer
The icons can themselves stand for the number of times they have been
pushed, thought of as a variable or as an as-yet-unknown. The equations can
readily be seen to be unsolvable, because
–
= 6s – 4t which is even, whereas
+
= 1 + 10u which is
odd.
So that task is impossible. If instead of 1, the target was to get the dials
pointing to 1, 2, and 5 respectively, then the equations are
+
= 1 + 6s where s is some integer,
+
= 5 + 10u where u is some integer
+
= 2 + 4t where t is some integer
92
Mathematics Education with Digital Technology
and these can be solved, to give
2
+2
+2
= 8 + 6s + 4t + 10u (adding all the equations).
Dividing by two and subtracting the equations in turn gives
= 2 + 3s – 2t + 5u;
= 3 – 3s + 2t + 5u;
= –1 + 3s + 2t – 5u;
To get a non-negative number of pushes for each button, take s =1, t = 0,
u = 0, yielding 5, 0 and 2 pushes respectively.
Here the icon for the button is used ‘symbolically’ to express desired
relationships. If users have done a good deal of button pushing and resetting, they may be glad of a structural rather than empirical approach to
deciding whether some goal is in fact possible at all.
The software offers extra ‘support’ for checking relationships, by treating
each button as an action, and multiplying it by the number of times you
want it to be pressed.
The mixture of icons and coeficients
becomes
an expression for the combined action, which can then itself become a
button. In this way learners are ‘actually’ operating in a module over the
integers, but their experience is of combining numbers of button
pushes.
There are two pedagogic dificulties emerging from Polydials. One is the
mathematically powerful switch of meaning of an icon (or a symbol) from
an action to counting the number of times the action is performed. This
dificulty is highlighted in ICT because of the difference between using a
name as an object to manipulate, and using a name to refer to something
else like a value. The other dificulty is endemic to software and tool
development generally. At every stage of sophistication, it quickly becomes
evident that ‘it would be nice to be able also to . . . ’. In the case of geometry,
such software would be able to suggest extra constructions, or the user
could select some elements of a diagram and treat them as a relationship
to be combined with other geometric relationships; in the case of Polydials
it is the desire to have access to some sort of ‘icon processor’ that, given
the icon-equations, will solve them in some perspicuous manner. Of
course symbol processing software such as mathematica and maple do this,
but they require signiicant algebraic competence on the part of the user.
The point is that it is highly likely that there will always be ‘another layer’
of generality of action that ‘it would be nice’ if software could perform
perspicuously.
Acting on Objects
93
Theoretical Dificulties and Practical Obstacles
There are differences between experiencing phenomena, being moved to
explain or justify them, and using tools to suggest, if not provide, that
explanation or justiication. For example, dynamic geometry software can
convince you that some property always holds without any hint of why it
must be the case. In the irst example, it is not at all clear from dragging
why it is that point D necessarily remains invariant. Indeed it requires either
trigonometry or linear algebra to be fully convinced of the necessity. Very
often in geometry, what is required is the addition of one or more extra
‘construction’ lines. In example 1 a perpendicular from P to the line AB
opens up a number of right-angled triangles and hence trigonometric relationships that can be expressed and manipulated.
Once you have a proof, it is often possible to build an animation which
shows the steps in the reasoning by directing attention to appropriate elements through the use of colour, thickness and lashing. Most of the many
different proofs of Pythagoras’ theorem can be displayed in this way as phenomena to be made sense of, as can many other theorems. The learner is
invited to describe, to bring to articulation the ‘animation sequence’, and
in the process, to re-construct the proof. However, it will only be a proof for
them if they are simultaneously aware of what in the particular diagram can
be changed and what must remain invariant, and how these invariances are
called upon in the reasoning.
Building up a proof through combining steps in reasoning suggested by
an animation or sequence of frames may support learners in experiencing
complex reasoning; getting them to be able to do the same for themselves
requires multiple shifts of attention as they discern pertinent elements, recognize structural relationships between those elements, introduce new
elements so as to be able to express and connect relationships, and perceive
those relationships as properties applying to a whole class of igures or
objects and not simply the ones in a diagram or in a particular case. Only
then does it make sense to isolate particular properties and reason solely on
the basis of those alone.
Even though facts, including statements of theorems and justiications
for those theorems, are readily available on the web, to use them as tools in
your own reasoning requires more than access to the internet. It requires
sophisticated mathematical thinking, including awareness that there could
be a relevant theorem, making connections through recognizing chains of
relationships, and competence, disposition and perseverance to pursue
94
Mathematics Education with Digital Technology
and check the reasoning needed for justifying any new or newly encountered phenomenon.
Learning from the Past
As mentioned in the Introduction, engaging learners by getting them to
interact with objects has an ancient pedigree: Plato praised Egyptian schools
for their use around 400BCE (Hamilton and Cairns 1961 p. 1388–9). But
while the use of apparatus for teaching primary mathematics is well developed, it is not at all clear that it is always effective. Experience alone is not
enough to guarantee learning from that experience. Use of pedagogic
apparatus does not have a good track record at secondary. The HMI reports
in the UK have frequently noted the absence of apparatus, and attempts to
promote the use of apparatus in secondary have been at best marginally
successful. For example, Cuisenaire rods became very popular for a time
while there was an extensive infrastructure (Goutard 1974) but together
with Dienes Blocks or Multi-Base Blocks they can be found at the back of
many school cupboards.
The problem is that despite the rhetoric, apparatus does not embody
mathematics. Rather, mathematics can be seen as embodied in apparatus.
Sometimes it is not clear whether you have already to understand something in order to perceive the embodiment! The subtle shift is at the heart
of the dificulties: it is not the apparatus that teaches, but rather the way of
working with the apparatus.
Following Bruner’s elaboration of his three modes of (re)presentation,
Kath Hart (1993) mounted a campaign for a time trying to ind evidence
for the effect of the use of enactive apparatus in secondary classrooms,
and came to the conclusion that the most common practice was to get
learners using apparatus, and then to switch to symbolic expression,
without much attention to the way in which the symbols express the
actions performed with the apparatus. Whereas Dienes (1960) and others
had thought in terms of mathematics being embodied in physical objects,
a chorus of counter-claims grew, pointing out that the mathematics is
in the eye of the beholder, not in the apparatus, nor even in the
phenomenon.
Learners almost always need to have their attention directed to the mathematical aspects of the actions performed on the objects. Indeed, mathematical concepts emerge as the expression of the structure of those actions,
perhaps as delineated by Bruner (1966) and perhaps in other ways as well.
Acting on Objects
95
The following quotations trace some of the controversy over the pedagogic use of apparatus.
One of the problems about using symbolism is how to ind the best time for
introducing it. If this is done too early, it tends to be an empty shell. Classroom work in mathematics can so easily degenerate into learning certain
rules by which the signs can be manipulated, and studying situations in
which they are applicable, each application being separately learned. This
of course is necessary if the signs do not symbolize anything. On the other
hand, it is possible to wait too long before introducing symbolism. When a
child has become familiar with a mathematical structure he needs a
language in which to talk about it, think about it, and eventually transform
it. New constructions need new names, their properties must be described
by new symbols if more of the detail of the structure is to be grasped at one
time, and so relected upon more effectively. (Dienes 1960 p. 160–61)
Links to the Open University frameworks are perfectly evident in Dienes’
analysis.
Before we recommend to teachers that they use manipulatives we should
advise them to view the appropriateness and limitations of the materials
for the purpose of leading to and authenticating a part of formal mathematics. [ . . . ] We need to research when manipulatives are appropriate
as well as the balance of time given to different activities within the same
scheme. (Hart, 1993, p. 27–28)
If learners’ sense of a concept is limited to particular contexts in which they
manipulate some physical objects, or if they associate a concept with particular objects, then the experience is as likely to be an obstacle as a help.
The same applies to metaphors such as ‘an equation is a balance’ which
runs into dificulties if it is maintained when you want to subtract things
from both sides (some people use ‘helium balloons’). As Dienes indicates,
it is as important to plan when to withdraw from reliance on the actions
(and the metaphors). Similar dificulties can arise when expression such as
‘larger from smaller you can’t do’ because some children refuse to alter an
established practice based on such a falsehood.
The whole point of performing actions is to pay attention to the effects,
to become aware of underlying structural relationships:
In mathematics learning, the intention to make sense is essential
(Erlwanger, 1973).
96
Mathematics Education with Digital Technology
Educators have railed against the misuse of apparatus. For example:
Often when manipulatives are used in teaching mathematics, the teacher
demonstrates the way they are to be used and students are left little freedom to give meaning to the experience in ways that make sense to them;
the way the materials are to be used is prescribed. There is the mistaken
belief on the part of the teacher that the mathematics is apparent in the
materials, for example, ‘base 10’ blocks (Cobb, Yackel and Wood, 1992).
This is based on the belief that mathematics is ‘out there’ and that models
‘show’ the concepts. The demonstration with concrete materials is quite
appealing because the concepts are so vivid for those who have already
made the construction. Thus there is the mistaken belief that since we, as
adults, can see the mathematics in the blocks, the students will too. But
the ‘seeing ‘ requires the very construction the activity is intended to
teach. (Wheatley 1992, p. 534)
Piaget emphasized the necessity of learners constructing meaning for themselves (Piaget 1980, p. 90–91), and Vygotsky (1978) emphasized the importance of the social practices within which the instruction is embedded as a
vital component of sense making.
Manipulatives are not, of themselves, carriers of meaning for insight.
‘Although kinaesthetic experience can enhance perception and thinking, understanding does not travel through the inger tips and up the
arm’ (Ball, 1992, p. 47). It is through their use as tools that students have
the opportunity to gain insight into their experience with them. Research
has shown that for children to use concrete representation effectively
without increased demands on their processing capacity, they must know
the materials well enough to use them automatically (Boulton-Lewis,
1998). If the user is constantly aware of the artifact then it is not a tool, for
it is not serving the purpose of enabling some desired activity which
moves one toward a desired goal state (Winograd and Flores, 1986). . . .
Students sometimes learn to use manipulatives in a rote manner, with
little or no learning of the mathematical concepts behind the procedures
(Hiebert and Wearne, 1992) and the inability to link their actions with
manipulatives to abstract symbols (Thompson and Thompson, 1990).
This is because the manipulative is simply the manufacturer’s representation of a mathematical concept that may be used for different purposes
in various contexts with varying degrees of ‘transparency’. (Moyer, 2001,
p. 176–77).
Acting on Objects
97
Algebraic symbols do not speak for themselves. What one actually sees in
them depends on the requirements of a speciic problem to which they are
applied. Not less important, it depends on what one is prepared to notice and
able to perceive. (Sfard, 1994, p. 192)
In order to promote effective learning from experience, Simon et al.
(2004) emphasize the importance of relections on the effect of actions. It
is not simply a latter of getting learners to act on objects, but to get them to
become aware of the effects of those actions. Furthermore, people develop
preferences for particular ways of acting which may not be either eficient
or readily abstracted. Anne Watson refers to super-methods as those which
apply to a wide variety of situations rather than being limited to a few special cases. For example, to ind the area of a rectangle there are many
different ways; which of these extend to other rectilinear shapes or to other
quadrilaterals? Counting squares is much less eficient than having a formula based on the lengths of the edges and the measure of suficiently
many angles.
From the Physical to the Virtual: But How Do You Get Back?
Electronic screens seem to provide a domain with enormous potential for
replaying all the confusions and misapprehensions about the role of physical apparatus in teaching and learning mathematics. They also present
some additional obstacles, as well as providing new affordances.
Merely manipulating objects on a screen is likely to be analogous to
manipulating physical objects: it is tempting for teachers to instruct learners in what to do, to get them to rehearse those actions, and then to expect
learning to come about. Even where the instruction includes careful introduction of technical language for describing and guiding those actions,
learners are just as likely to absorb the practices without being able to generate those actions for themselves from understanding as in any other form
of instruction. The didactic tension, a consequence of the didactic contract of
Brousseau (1997) is ever-present:
The more clearly the teacher indicates the behaviour being sought, the
easier it is for learners to display that behaviour without generating it
from themselves.
Because of the didactic contract, learners exert pressure on teachers to ‘tell
them what to do’, and sometimes, due to the apparent shortage of time, it
98
Mathematics Education with Digital Technology
even appears to be eficient. But the whole point of manipulating objects is
to become aware of, to get-a-sense-of, and then to try to bring to articulation, relations between objects, and relations between actions. The extra
dificulty presented by objects of screens is that there is a curious phenomenon associated with closing down the software or turning off the machine:
the images, the bodily awarenesses evaporate so suddenly that there is often
a minute gap when nothing at all is being attended to (Mason 1985). Thus
learning from virtual objects depends on an ongoing process of sense-making, of trying to articulate that sense, and of creating labels for actions that
prove to be effective. The speed of computers makes empirical guess-andtest more viable and more attractive than ever before, yet it is precisely the
awareness that structural relationships can be used to generate eficient
techniques for resolving problems and for explaining or predicting phenomena that marks signiicant learning.
The constructs of situated cognition and situated abstraction have been used
to act as reminders that people can readily learn to carry out speciic actions
in speciic situations, but recognizing something about a new situation that
brings to mind actions carried out in the past, and reconstructing those
actions from understanding of the structural relationships that makes them
effective requires much more. When you return to some software, like riding a bicycle after a period away, a great deal of locally achieved competence can come looding back. But the issue is whether what is learned can
be used elsewhere in the future. How do you take something useful from a
virtual world and use it in the world of mental imagination, or in the world
of material objects? What is it exactly that is useful? All this requires ongoing
relection and re-construction.
Conclusion
It is tempting to conjecture that as virtual objects become more sophisticated, and as the actions that can be performed on and with them become
more complex, the necessity for disciplined ways of working involving withdrawing from action and bringing to articulation what the actions are, what
their effects are, and in what circumstances might those actions be useful in
the future can only increase markedly. To emerge from the virtual with
actions and awareness of relationships that can be used effectively and eficiently in the material and mental worlds requires disciplined practices.
These are what really need to be taught.
Acting on Objects
99
Note
1
I choose to put brackets around the preix because in most cases what is being
offered is a presentation rather than a re-presentation, and I ind it very helpful to
be re-minded of this when thinking about actions on objects.
References
Bailey, D., Borwein, J., Calkin, N., Girgenshohn, R., Luke, D. and Moll, V. (2007).
Experimental Mathematics in Action. Wellesley: A. K. Peters.
Ball, D. (1992). ‘Magical Hopes: Manipulatives and the Reform of Math Education’.
American Educator, 16 (2), 14–18, 46–7.
Boulton-Lewis, G. (1998). ‘Children’s strategy use and interpretations of mathematical representations’. Journal of Mathematical Behavior, 17 (2), 219–37.
Brousseau, G. (1997). Theory of Didactical Situations in Mathematics: Didactiques des
Mathématiques, 1970–1990. N. Balacheff, M. Cooper, R. Sutherland and
V. Warield, (trans), Dordrecht, The Netherlands: Kluwer Academic Publishers.
Brown S., Collins A. and Duguid P. (1989). ‘Situated cognition and the culture of
learning’. Educational Researcher, 18 (1), 32–41.
Bruner, J. (1966). Towards a Theory of Instruction. Cambridge, MA: Harvard University
Press.
Cobb, P., Yackel, E. and Wood, T. (1992). ‘Interaction and learning in mathematics
situations’. Educational Studies in Mathematics, 23, 99–122.
Dagomari, P. (1339). Trattato d’Abbaco. D’Astronomia, e di Segreti Naturali e medicinali. ms.
Dienes, Z. (1960). Building up Mathematics. London: Hutchinson Educational.
Erlwanger, S. (1973). ‘Benny’s conception of rules and answers in IPI Mathematics’.
Journal of Mathematical Behaviour 1 (2), 7–26.
Hamilton, E. and Cairns, H. (eds) (1961). (W. Guthrie, Trans.), Plato: The Collected
Dialogues Including the Letters, Bollingen Series LXXI. Princeton, NJ: Princeton
University Press.
Hart, K. (1993). ‘Conidence in success’. In I. Hirabayashi, N. Nohda, K. Shigematsu
and F-L. Lin (eds) Proceedings of Psychology of Mathematics Education, PMEXVII, Vol.1, p. 17–31, University of Tsukuba, Tsukuba,.
Hiebert, J. and Wearne, D. (1992). ‘Links between teaching and learning place
value with understanding in irst grade’. Journal for Research in Mathematics
Education, 23, 98–122.
Hill, J. (1745). Arithmetick, Both in the Theory and Practice, Made Plain and Easy in All
the Common and Useful Rules, Both in Numbers and Fractions, Vulgar and Decimal . . .
the Like Not Extant. Printed for R. Ware, J. and P. Knapton, T. Longman, C. Hitch
and L. Hawes, J. Hodges, S. Austen, J. and J. Rivington, J. Ward, and M. Cooper,
London.
Love, E. and Mason, J. (1992). Teaching Mathematics: Action and Awareness. Milton
Keynes: Open University.
Mason, J. (1980). ‘When is a Symbol Symbolic?’ For the Learning of Mathematics 1 (2),
8–12.
100
Mathematics Education with Digital Technology
Mason, J. Burton, L. and Stacey, K. (1982). Thinking Mathematically. London: Addison Wesley.
—(1985). ‘What do you do when you turn off the machine?’ Preparatory paper for
ICMI conference: The Inluence of Computers and Informatics on Mathematics and its
Teaching, pp. 251–56. Strasbourg: Inst. de Recherche Sur L’Enseignement des
Mathematiques.
Mason, J., Drury, H. and Bills, E. (2007). ‘Explorations in the zone of proximal
awareness’. In J. Watson and K. Beswick (eds) Mathematics: Essential Research,
Essential Practice: Proceedings of the 30th annual conference of the Mathematics Education Research Group of Australasia, vol. 1, pp. 42–58. Adelaide: MERGA.
Mason, J. and Johnston-Wilder, S. (2004). Designing and Using Mathematical Tasks.
Milton Keynes: Open University. Re-published (2006). St Albans: Tarquin.
Moyer, P. (2001). ‘Are we having fun yet?: How teachers use manipulatives to teach
mathematics’. Educational Studies in Mathematics, 47, 175–97.
Piaget, J. (1980). Adaptation and Intelligence: Organic Selections and Phenocopy. Chicago:
University of Chicago Press.
Polya, G. (1962). Mathematical Discovery: On Understanding, Learning, and Teaching
Problem Solving. Combined edition. New York: Wiley.
Sfard, A. (1994). ‘Reiication as a birth of a metaphor’. For the Learning of Mathematics, 14 (1), 44–55.
Simon, M. A., Tzur, R., Heinz, K. and Kinzel, M. (2004). ‘Explicating a mechanism
for conceptual learning: Elaborating the construct of relective abstraction’.
Journal for Research in Mathematics Education. 35 (5), 305–29.
Smith, D. (1908). Rara Arithmetica: A Catalogue of the Arithmetics Written before the Year
MDCI with a Description of Those in the Library of George Arthur Plimpton of New York
by David Eugene Smith of Teachers College Columbia University. New York: Athanaeum
Press.
Thompson, P., and Thompson, A. (1990). ‘Salient aspects of experience with concrete manipulatives’. In Proceedings of the 14th Annual Meeting of the
International Group for the Psychology of Mathematics, pp. 46–52. Mexico City
van der Veer, R. and Valsiner, J. (1991). Understanding Vygotsky. London: Blackwell.
Vygotsky L. (1978). Mind in Society: The Development of the Higher Psychological Processes.
London: Harvard University Press.
Wheatley, G. (1992). ‘The Role of Relection in Mathematics Learning’. Educational
Studies in Mathematics, 23, 529–41.
Winograd, T. and Flores, F. (1986). Understanding Computers and Cognition: A New
Foundation for Design. Norwood: Ablex,
Wolfram, S. (2002). A New Kind of Science. www.wolframscience.com (accessed on
September 2009).
Chapter 10
A Case Study of Using Multiple Resources to
Teach Straight Line Graphs
Rosemary Deaney and Sara Hennessy
Faculty of Education, University of Cambridge, UK
Introduction
We present the indings of a video-based case study of teaching and learning about straight line graphs. The research was part of the wider T-MEDIA
project1 (Hennessy and Deaney, 2007) which investigated how teachers
promote student learning in secondary school subject lessons incorporating the use of Information and Communications Technology (ICT), particularly digital data projection and interactive whiteboard systems. This
account focuses on how an experienced UK mathematics teacher, Sarah,
exploited a variety of digital tools over a six-lesson series to develop her
12- to 13-year-old students’ understanding of the concepts of intercept and
gradient of straight line graphs. Through collaborative review of lesson
videos with Sarah and her departmental colleague, we identiied and documented key pedagogical aspects of her approach (see Hennessy and Deaney,
2009 for a detailed account of this process).
Sarah was head of her mathematics department and committed to
working with mixed groups of students across the attainment range. She
had participated in previous research with us and we knew that technology
use was embedded within her practice. She routinely used a data projector
and half class set of laptops in her lessons, with a variety of software; in the
observed lessons this included dynamic graphing (Autograph) and spreadsheet packages, and an online Mathematics site (MyMaths).
Our analysis highlighted Sarah’s pedagogical strategies for mediating
learning with technology within four broad areas2:
1. Using multiple tools and resources
2. Fostering a supportive and collaborative learning environment
102
Mathematics Education with Digital Technology
3. Developing concepts and responding to learning needs
4. Capitalizing on unexpected outcomes and errors
Using Multiple Tools and Resources
Sarah believed that using technology made it easier to vary activities and
segment work in ways that were motivating to pupils. She favoured ‘mixing
and matching’ materials from different sources, rather than adopting particular programmes. The department had no interactive whiteboards but
Sarah used a tablet computer linked with the data projector which also
acted as a mobile input device for pupils during whole class teaching.
Throughout the series, Sarah brought into play a variety of software tools
selected for different purposes, including: online games to practise coordinates; spreadsheets to generate a formula to calculate the incremental
increase of a given variable and produce a corresponding line graph and
Autograph to generate lines from given equations. There were also more
open-ended explorations of linear equations using an interactive tool in
MyMaths, and use of a class response system to assess learning via teachergenerated multiple choice items. Non-ICT resources included matched
cards for graph recognition and off-the-shelf and custom worksheets used
in conjunction with tasks on the computer.
Fostering a Supportive and Collaborative
Learning Environment
One of the most notable aspects of Sarah’s practice was the highly supportive and co-operative learning environment through which she encouraged
pupil participation. Activities and interventions were carefully structured to
offer appropriate challenge or support for individual learners, developing
conidence to participate.
Sarah consistently gave status to, and valued pupil contributions, drawing
on these as a resource. There was a deliberate strategy of praise and encouragement, especially through focusing on the correct or relevant part of a
pupil’s response.
Collaboration was fostered in both whole class and group-work situations.
Sarah built on pupils’ answers by further questioning or sensitively drawing
in other pupils to challenge, corroborate or offer assistance. If a pupil became
‘stuck’ for an answer, they were invited to call on a peer. Where solutions
were gained collaboratively, Sarah’s feedback was inclusive, crediting peer aid.
Using Multiple Resources
103
Sarah often called pupils up to the whiteboard to explain some aspect,
seeing this as beneicial to the learning of all concerned. Strategic questioning as she circulated prompted pupils to formulate and articulate (rehearse)
their thinking, making it easier to speak out in whole class discussion when
invited later on.
Watching and monitoring peer input at the board was a powerful mechanism for engaging pupils through vicarious involvement.
If they make the wrong move, or they’re about to do something, other
pupils will actually join in and tell them what to do . . . which they wouldn’t
do if it was me.
This was extended through pupil use of the tablet; for example, after plotting a line parallel to y = 2x + 3, Sarah challenged one pair to enter a new
parallel line using the tablet, thereby demonstrating their knowledge to the
class.
Weaker pupils were often paired with more able ones, but required to ill
in worksheets individually. Peer tutoring and direction were encouraged and
grouped arrangement of tables facilitated this style of working.
Motivating Pupils through Making Activities Accessible
Sarah offered accessible, focused learning activities and reduced writing requirements; for example, providing a spreadsheet template helped pupils to focus
on ‘seeing a relationship’ rather than on the routine task of generating a
graph.
Whole class games were used to introduce or revise key terms (intercept,
origin, gradient) and (MyMaths) online games were a ‘fun way to practise
co-ordinates’ in pairs. Sarah held that students ‘learn by doing, not just by
watching’ but her interventions were inluential in ‘mathematizing’ situations in relation to lesson aims.
Developing Concepts and Responding to
Learning Needs
Tasks were designed to mobilize or scaffold discovery of the relationship
between the equation and its graph:
To be able to use Autograph and just plot y = x + 2, x + 3, x + 4, x + 50,
x – 2, they are going to be able to see straight away that whatever num-
104
Mathematics Education with Digital Technology
ber you add or subtract at the end of the equation is the intercept on
the y-axis . . .
The technology enabled her to focus on particular aspects such as the
gradient and the intercept and then to discuss how they ‘itted in’.
Sarah provided highly responsive assistance. Sensitivity to group and individual needs led her to change course lexibly where needed, directing
pupils towards targeted materials. Sarah was also mindful of the constraints
as well as the beneits of available resources. For example, guarding against
pupils ‘just zooming through’ online screens without engaging suficiently
with content, she circulated and monitored activity, questioning to check
understanding.
Sarah’s interactions were carefully phrased to elicit knowledge, make
reasoning explicit – subtly ‘reshaping’ thinking or guiding in a particular
direction through ‘funnelling’ prompts. As well as scaffolding activity, Sarah
also strategically withdrew support (‘fading’), stimulating pupils to take the
next steps themselves.
‘Intertwining’ resources and planning activities to scaffold learning
Teaching offered staged introduction to new concepts through referencing
everyday objects (e.g., discussion of ‘slope’). It was interspersed with exploration, discovery and practice (mainly using Autograph, guided with worksheets). Later on, the MyMaths interactive tutorial was used to consolidate
knowledge – which was then applied in a inal activity requiring generation
of parallel lines.
Sarah drew on an array of digital and non-digital resources to hand in the
classroom to illustrate her explanations, for example representing positive
and negative numbers with coloured plastic cubes.
She also built in tasks to prime for forthcoming activities and pre-empt conceptual dificulty. For example a starter activity relating fractions with division preceded calculating gradient:
I wanted them to see . . . the distinction between 4 over 2 and 2 over 4
because I thought that would be a point where they might get a little bit
muddled – and sure enough, later on in the lesson, it was!
There was a balance of ‘independent’ enquiry with collective knowledge building, as
Sarah switched between whole class and small group modes: for example
generating a series of graphs led pupils to notice that ‘the number before x
Using Multiple Resources
105
was always the same as the gradient’; using worksheets to guide their
investigation, pupils then plotted graphs manually from given equations
and checked their work using Autograph; the inal plenary explored the
visual effects of altering the gradient. This guided approach helped to guard
against the danger of pupils acquiring idiosyncratic knowledge (Godwin
and Sutherland, 2004), becoming ‘stuck’ or changing too many parameters
at once and so failing to see the effect of one (Goldenberg, 1995).
Activities were interspersed throughout lessons with mini-plenaries, where
Sarah explained and discussed emerging issues or introduced, demonstrated or modelled the next step. Projection technology assisted here,
especially for stepwise knowledge building, consolidation and assessment
of learning.
Sarah felt that one of the dangers of using ICT was that ‘pupils don’t
relate that to how they would do things on paper’ so intertwining modes of
working was designed to ensure they had ‘both sets of skills and are able to
see the links between them.’ For this reason the second lesson comprised
paper-based consolidation activities for topics already given an ICT-based
treatment. As well as recapping previous knowledge, these activities helped
to familiarize pupils with the relationship between an equation and its
graph and to prime for investigative work using Autograph in subsequent
lessons.
Sarah blended use of ICT and non-ICT tools. Visual display, both at the front
of the class and on laptop screens, formed an important focus for dialogue
and joint reference at whole class and small group levels. Projecting
materials onto a rollerboard enabled them to be annotated with a marker
pen. A separate, non-digital whiteboard was also used to display key reference material during the lesson, for example, aims, key words and software
access instructions. It also provided an area where pupils could record or
work through ideas during whole class interactions, as an adjunct to the
main projected display.
Capitalizing on Unexpected Outcomes and Errors
The school’s ethos emphasized the value of learning from mistakes and
Sarah’s approach encouraged pupils to develop this perspective:
Some of them have still got this idea that things are ‘wrong’ and ‘right’ in
Maths and it’s trying to get them away from that . . . and it doesn’t matter
if you’re thinking along a different line – that could be useful as well.
106
Mathematics Education with Digital Technology
The instant feedback afforded by technology was seen as helpful in recognizing errors and Sarah made space for pupils to spot mistakes and anomalies.
For example, pupils were asked to suggest points on the line y = 2x + 1
beyond the segment visible on screen. One pupil’s suggestion of (111, 0)
was accepted provisionally, and written on the board. As the discussion progressed, he recognized his mistake and asked to correct it; Sarah’s prompting and peer aid enabled him to reach the answer of (111, 55), a solution
veriied by show of hands from the group.
Technology was deliberately harnessed to facilitate self-correction, for
example auto-plotting on the computer served to corroborate manual
graph production and highlight plotting errors. Interestingly, use of
technology itself generated some unexpected results (Hoyles and Noss,
2003). Sarah’s mediation was pivotal in achieving learning gains when these
situations arose. For example, during use of Autograph, a pupil was surprised and pleased to obtain two parallel lines on screen after having
entered y = – 2x + and – 2. Sarah explained the meaning of the ± symbol
that had been generated by Autograph from his input, then prompted him
to identify intercepts on the y-axis and to observe that the gradients of the
two lines were the same. This example was particularly fortuitous as it
meshed with the aims of the lesson.
Conclusion: An Adaptive Approach to
Harnessing Technology
These various facets of Sarah’s approach collectively illustrate an adaptive
style of teaching that embraces the wide diversity of individual differences
encountered in a very mixed class of students. Rather than seeing these differences as obstacles, Sarah exploited them through designing activities
and student pairings where learners with different proiles or styles could
work together productively. Her adaptive teaching involved continuously
offering support and challenge in direct response to learning needs and
motivation – in order to create a learning arena in which everyone could
participate with conidence.
A Multimedia Resource for Collaborative
Teacher Development
The four themes outlined above are described and illustrated in a multimedia resource produced by the research team (Figure 10.1).3
Using Multiple Resources
Figure 10.1
107
A Video Clip Screen from the T-MEDIA Resource
It contains a set of hyperlinked video clips and analytic commentary, with
built-in points for relection and discussion. Designed as a tool for continuing professional development (CPD), the resource aims to stimulate
debate rather than present a model of best practice. The resource is freely
accessible via the NCETM portal4; interested readers may wish to view
video clips illustrating the themes and activities outlined above. The site
also hosts a ‘toolkit’ document commissioned by NCETM which guides
departments through the resource and supports collaborative teacher-led
CPD – concerning either pedagogical approaches or effective uses of
technology. Our model of CPD is based on an iterative cycle of teacher-led
discussion, peer lesson observation, collective relection and reinement.
Early trials in three schools point to the effectiveness of this approach in
stimulating pedagogical relection and change. (Bowker et al., 2009).
Notes
1
2
The T-MEDIA (Exploring teacher mediation of subject learning with ICT: A multimedia
approach) project (2005–2007) was funded by the Economic and Social Research
Council, grant ref: RES-000–23-0825.
Organizational routines for managing use of the technology were also identiied
but space precludes detailing these here.
108
3
4
Mathematics Education with Digital Technology
This can be ordered in CD-ROM format at cost price via our website at www.
educ.cam.ac.uk/research/projects/istl which also hosts further (existing and
forthcoming) reports of this work.
National Centre for Excellence in Mathematics Teaching: www.ncetm.org.uk/
resources/7045.
References
Bowker, A., Hennessy, S., Dawes, M. and Deaney, R. (2009). ‘Supporting professional development for ICT use in mathematics using the T-MEDIA multimedia
resource’. In M. Joubert (ed.), Proceedings of the British Society for Research
into Learning Mathematics, vol. 29, (1) pp. 19–24. Cambridge.
Godwin, S. and Sutherland, R. (2004). ‘Whole class technology for learning mathematics: The case of functions and graphs’. Education, Communication &
Information, 4 (1), 131–52.
Goldenberg, E. P. (1995). ‘Ruminations about dynamic imagery’. In R. Sutherland
and J. Mason (eds) Exploiting Mental Imagery with Computers in Mathematics Education, pp. 202–24. Berlin, Heidelberg: Springer-Verlag.
Hennessy, S. and Deaney, R. (2007). Teacher Mediation of Subject Learning with ICT: A
Multimedia Approach (RES-000–23-0825). Final Report to ESRC.
—(2009). ‘ “Intermediate theory” building: Integrating multiple teacher and
researcher perspectives through in-depth video analysis of pedagogic strategies’.
Teachers College Record, 111 (7), 1753–95.
Hoyles, C. and Noss, R. (2003). ‘What can digital technologies take from and bring
to research in mathematics education?’ In A. J. Bishop, M. A. Clements, C. Keitel,
J. Kilpatrick and F. K. S. Leung (eds), Second International Handbook of Mathematics
Education, pp. 323–49. Dordrect, The Netherlands: Kluwer Academic Publishers.
Part Four
Description of a Range of
ICT Tools
Digital technologies, and their applications, are being developed at a great
pace and throughout the world. Many of the ‘drivers’ for such developments have little or no obvious connection with education, at least at irst
sight. One large part of the market is for home entertainment, which
includes gaming, simulation and the use of control devices – many now
wireless – like paddles, bats, steering wheels, and so on. Another market is
for mobile communications including telephones, cameras, internet,
audio/video streaming, social networking, blogs, podcasts, and so on. A
third, particularly for software development, is commercial use by employees in companies, organizations, R&D, and so on. Contributors to this
chapter have been given a brief to highlight digital developments they see
as having most to offer to education in general and to (teaching and) learning mathematics in particular.
Chapter 11
Emerging Technologies for Learning and
Teaching
Vanessa Pittard
Director of e-Strategy at the British Educational and
Communications Technology Agency, UK
Introduction
Rapid Change
Looking back over the last ten years we can see a period of rapid technologybased change in learning and in society more generally. The internet and
networked computers have led to signiicant shifts in how information and
resources are accessed and developed. And for children and young people,
their teachers and citizens more generally, personal access to computers
and the internet is increasingly considered a norm.
In addition there is an increasingly rich range of devices and tools which
can support learning in a variety of ways. This section looks at new and
emerging technologies for learning, exploring the opportunities they present for what teachers can do to build more effective learning.
Technology versus Practice
In any analysis of the role of technologies, however, it is important not to be
beguiled by the technology itself. It is more important to remember that
the irst aim in adopting and developing any technology is that it is there
for learning. So any consideration of future technologies should be framed
to relect that, taking into account not only how learning happens, but also
the contexts of learning – schools, homes, classrooms and curricula. It also
112
Mathematics Education with Digital Technology
needs to set the beneits to learning against costs of implementation and
change.
Becta has recently funded a major project led by the University of
Nottingham and SERO Consulting to look at effective modes of learning
that can be enabled by technology. In a recent report from the project
(Sharples et al., 2009), the authors cite Richard Clark’s point that technology (‘media’) will not change learning. Rather, it is change in practice
that will do so (Clark, 1983, 1994).
Technology offers signiicant new opportunities to change practice. That
is, develop and improve the interactions of learning between learners,
teachers, symbols and objects. It is increasingly the role of educators and
planners to understand technology-based opportunities for learning and
translate these to possibilities and developments within their own contexts.
By taking a considered approach to this, real beneits for learners can be
achieved.
New and Emerging Technologies
Becta’s ‘emerging technologies for learning’ site1 draws together news,
research, analysis and views around technology developments relevant to
education. It provides an environment for debate on technology futures
within the education community and those serving it, encouraging dialogue
and building shared understandings about the future. Further research
studies on technology in practice are published on the research pages of
the Becta website. The following sections draw on developments identiied
through these services, so thanks go to the various authors and Becta
research teams who have provided contributions and analysis. I’ve presented
these developments are presented in no particular order.
Virtual Worlds and Simulations
The term ‘virtual world’ is a broad one, ranging from simple interactive
micro-worlds, to more complex simulations and immersive environments.
What they share in common is the power of computing and multimedia to
present an analogue of a world that users can interact, manipulate and experiment with. Such systems are not new to maths. However, system capabilities
are developing rapidly, driven by increasingly powerful computing environments leading to greater handling of complex data, rich multimedia, direct
manipulation, environment construction, and sharing and collaboration.
Emerging Technologies
113
These capabilities are particularly powerful when combined with common features such as the ability to overlay or present symbolic (e.g., mathematical) data and concepts alongside real phenomena. As Gorse et al.
(2009) observe based on their study of virtual worlds tools for maths, such
linking is especially important to help learners with real and applied
maths.
Sarah deFreitas presents several examples of curriculum-based learning
in virtual worlds which illustrate the potential of such environments
(deFreitas, 2006, 2008). The use of rich virtual worlds is increasingly extending beyond professional training and development, with which they have
been associated, to school and college learning. This also includes examples
of effective learning in immersive social environments such as Second Life
(Twining, 2007), which can support collaborative problem solving and
higher order relection.
Games-based Learning
Games-based learning is closely related to virtual worlds and simulations.
Again, the use of games to support maths learning is not new. Instructional
games, for example, have been around for a long time. However, as with
virtual worlds, game-related technology is developing rapidly. In addition to
improvements in interactivity, multimedia and online collaborative tools,
the last few years have seen learning become a greater focus in leisurebased gaming (for example, ‘brain-training’ approaches and virtual learning games). As a result, there are now several games-based learning projects
in education using commercial games.
Paul Pivec (2009) has recently taken a critical look at games-based
learning as a whole, including some of the claims made for the use of
games-based approaches in education. Overall, he is positive about the
potential of games in education, citing positive evidence of increased
time on task, willingness to return to learning tasks, engagement of dificult to engage learners, and cognitive and higher-order learning beneits.
Futurelab’s recent report for educators on young people, games and
learning (Williamson, 2009) is also positive, particularly in terms of
strengthened learning relationships between teachers and students. Pivec’s conclusion is that the real value from games-based learning comes
from teacher-led, structured activities taking place around the games.
This is ‘games-based teaching’. This is true for new environments more
generally, including virtual worlds and related developments such as augmented reality2.
114
Mathematics Education with Digital Technology
Personal and Mobile Devices
One of the most striking trends of recent years is the development of personal mobile computing, whether through hand-held devices such as
enhanced mobile phones or the use of netbooks and cut down laptops.
Coupled with increasingly common mobile wireless access, we are moving
closer to continual access to computing power and networks. David Ley
(2007) points to the trend continuing beyond personal access towards pervasive computing, whereby technology becomes weaved into everyday life
to an even greater degree. As technology develops, we will become more
used to accessing networks and information on demand, and this will have
an impact on how we work and learn.
Meanwhile the use of personal devices in classrooms in real time has
delivered important opportunities for educators. Becta has supported
research into the use of 1 to 1 hand-held devices for primary and secondary
students (McFarlane et al., 2009). In both cases the students used the
devices to support learning in a range of ways, including general internet
search, taking photos, making presentations and accessing resources in
class. Students were enthusiastic about personal access, using terms like
help/helpful, fun/enjoy/enjoyable, interesting, easier, useful and handy.
Access to the internet (not having to go to the computer room or compete
for the computer at home) was a key beneit.
Elizabeth Hartnell-Young’s study of the use of mobiles in school reinforces
indings from the one–to-one hand-held evaluation (Hartnell-Young, 2008).
Implementing personal mobile technologies for all needs to be led by the
school and guided through appropriate policies, for example relating to
internet access policy and acceptable behaviour. But as personal technologies develop, more schools will look to these to support learning.
Display Technologies and Interfaces
Educational researchers such as Liz Burd and her team at Durham University
are experimenting with one example of next generation of interactive display technology – Lumin tables3. These displays take the technology we are
now familiar with in hand-held devices such as Apple’s ‘i-Pod touch’ and
make it larger, and responsive to multi-touch. The Durham project will
work with schools to build software tools and develop school-based uses.
Michael Haller has taken a look at the range of related technologies,
exploring their potential to improve interaction with computers and facilitate collaborative activities in more natural and intuitive ways (Haller, 2008).
Emerging Technologies
115
He argues that this intuitive interactive quality is important for learning and
that these interactive interfaces could help students to become more actively
involved in working together with content and could also improve wholeclass teaching activities. It is certain that these technologies have considerable appeal for learning and teaching, and potential to support both learners
and teachers interacting with objects and with each other in different ways.
Haller offers a view on other promising developments in interfaces and
display technologies such as interactive pens and paper. These technologies
support of information exchange between computer and non-computer
devices (e.g., enabling quick digitization of what students write in exams).
Though it is unclear when or how these technologies might come into use,
they may have potentially useful applications in education settings.
Online and Blended Learning
As with other developments listed above, online learning is not a new concept. However, changes to the context of learning mean that there is a new
climate for online and blended learning. For example, most young people
now have good personal access to the internet and are comfortable leading
many aspects of their lives online. The ‘science’ of online learning has
developed, and this includes models of tutor/mentor support and building
learning communities. Though not all students will beneit, online learning can support ‘catch-up’ and improve differentiation and choice in
learning.
Becta recently looked at emerging uses of online and blended learning
by schools, commissioning Manchester Metropolitan University to develop
models of effective use based on evidence (Lewin et al., 2008). In a context
where individual tuition is becoming increasingly important, especially for
learners who are falling behind, online solutions may in fact provide a way
of freeing some teacher time to focus on just that. Schools will need to
make decisions locally. However, it is clear that online learning will become
an increasing feature for school-aged learners, whether used formally or
informally. Teachers will need to make judgements about what will be truly
effective in supporting learning.
Conclusion
There are a range of ongoing and new developments in learning technologies, many with potential to enhance and transform maths teaching.
116
Mathematics Education with Digital Technology
Technology tools provide the opportunity to deliver truly excellent learning and teaching as never before. Some of these, as with multi-touch surfaces, are relatively new and their development needs to be tracked and
understood. Becta will continue to share evidence and support discussion
by teachers about the potential and role of these developments for
learning.
What is clear from more developed approaches, like serious games and
online learning is, as a 2009 Australian Learning and Teaching Council
report concludes, learning technologies need to be clearly integrated with
curriculum and assessment to add real value to learning. It is the role of
schools and teachers to discuss how that can be achieved and plan well for
a future in which technology is part of the fabric of learning.
Notes
1
2
3
http://emergingtechnologies.becta.org.uk/
http://emergingtechnologies.becta.org.uk/index.php?section=etn&rid=14696
http://tel.dur.ac.uk/?p=23
References
Australian Learning and Teaching Council (2009). ‘Educating the net generation: A
handbook of indings for practice and policy’ www.netgen.unimelb.edu.au/outcomes/handbook.html (accessed on 5 February 2011).
Clark, R. E. (1983) ‘Reconsidering research on learning from media’, Review of
Educational Research 53 (4), 445–459
—(1994). ‘Media will never inluence learning’. Educational Technology Research and
Development, 42 (2), 21–29.
deFreitas, S. (2008). ‘Emerging trends in serious games and virtual words’. SGI/
Becta http://emergingtechnologies.becta.org.uk/index.php?section=etr&mark
er=3&ilter=ArtTec_001
—(2006). ‘Learning in Immersive worlds’. JISC. www.jisc.ac.uk/media/documents/
programmes/elearninginnovation/gamingreport_v3.pdf
Gorse, C., Dickinson, I. Shepherd T, Whitehead, P and Walker, C. (2009) ‘Virtual
maths in an industrial context: Learning with new and emerging technologies,
Final report’, BECTA. March 2009
Haller, M. (2008). ‘Interactive displays and next generation interfaces’. Becta.
http://emergingtechnologies.becta.org.uk/index.php?section=etr&catcode=E
TRE_0001&rid=14164
Hartnell-Young, E. (2008). ‘How mobile phones help learning in secondary schools’.
Becta http://partners.becta.org.uk/index.php?catcode=_re_rp_02&rid=15482&
section=rh
Emerging Technologies
117
Lewin, C., Whitton, N., Cummings, J., Roberts, B., Saxon, D., Somekh, B. and Lockwood, B. (2008). ‘MILO: Models of innovative learning online’. Becta. http://
partners.becta.org.uk/index.php?section=rh&catcode=_re_vi_hi_03&rid=15545
Ley, D. (2007). ‘Ubiquitous computing’. Becta. http://partners.becta.org.uk/uploaddir/downloads/page_documents/research/emerging_technologies07_
chapter6.pdf
McFarlane, A, Triggs, P and Ching Yee, W (2009) Researching Mobile Learning:
Overview, Becta.
Pivec. (2009). ‘Game-based learning or game-based teaching?’ Becta. http://
emergingtechnologies.becta.org.uk/index.php?section=etr&rid=14692
(accessed on 5 February 2011).
Sharples, M., Crook, C., Jones, I., Kay, D., Chowcat, I., Balmer, K. And Stokes, E.
(2009). New modes of technology enhanced learning: opportunities and
challenges. Becta.
Twining, P. (2007). ‘The schome-NAGTY teen second life pilot’. Final Report. Open
University. http://kn.open.ac.uk/public/getile.cfm?documentileid=11344
Williamson, B. (2009). ‘Computer games, schools, and young people: A report for
educators on using games for learning’. Futurelab www.futurelab.org.uk/
resources/documents/project_reports/becta/Games_and_Learning_
educators_report.pdf (accessed on 5 February 2011).
Chapter 12
Home and School – Bridging the Gap
Russell Prue
Educational Consultant and Journalist
Introduction
Before we start to look at tools for our trade as mathematicians, we need to
briely examine how Information and Communications Technology (ICT)
is being used within our organization and establish a strategic way forward.
Pockets of innovation are hard to maintain without a holistic approach to
your organization’s use of learning and teaching technology. It is for this
reason that I am not going to be covering the latest developments in virtual
on-screen geometric drawing tools, and neither will I comment on which
spreadsheet is best for maths. It is more important to consider how these
and other tools are used within the context of learning and teaching.
Everything we know about everything is available online. It is possible to
teach a child a full and varied curriculum without ever going near a school.
The internet has demographically shifted the access to learning and Web
2.0 tools, Facebook, Youtube, Twitter continue to shape the way information is
presented. Traditionally we would go to a library, use their indexing system
to search on keywords, subject categories, titles and genres. Using the Internet and Web 2.0 tools, every word is now a keyword, every article can be
searched and linked in ways never before considered. Knowledge is cheap.
Creativity and problem solving skills are the new measures of success. It is
not enough to say that our use of ICT is exemplary just because we have
replaced our dry marker boards with an interactive whiteboard, many of
which are simply not being used as effectively as intended.
While we continue to insist on measuring memory and not the true ability of the learner, the real potential of ICT will continue to evade us. Perhaps that might continue to happen for many years to come but I doubt it.
Early indications are that new exams are emerging and with OCR leading
the way with modular, online, paperless tests that are taken when the learner
Home and School – Bridging the Gap
119
is ready there is still hope. In lots of classrooms right now many of our
young learners are simply missing out on the opportunity of using the true
potential that ICT offers learning and teaching. We know that when technology is left in the hands of learners it is often used in exciting and creative
ways that many educators do not appreciate. Quite different to the methods
and adoption classroom practitioners have been encouraged and forced to
follow. Often technology is simply used to replace older methods of working. Maths text books have been replaced by online worksheets and sometimes by crude software.
If, for just one moment, you accept that we are lost in a sea of technology
and are asking someone for directions to the promised land would we be
surprised to hear ‘you don’t want to start from here’. Perhaps it’s just not
possible to start from anywhere else and the best that we can do is while on
this journey is to ask some really dificult and unpopular questions about
how and why we are using ICT. To successfully embrace some of this new
technology in our learning and teaching we must be prepared to stop doing
what we have always been doing. Often that means stop trying to bolt stuff
on and instead take a radical look at what we are trying to achieve.
Mathematics has had, and will always have, an inseparable link with computing, after all everything we do with digital technology has been developed from an understanding of maths. Take away FREE Mobile Phone GPS
tracking within Google Earth, take away social networking and everything
else we do with computer based tools and all you have left are a series of
mathematical calculations based on the crudest of all languages, Binary!
I think that while educators need currency to buy learners’ attention;
(leaving aside the moral and political dimension to this), there is a valid
case for using technology. This can and often does have an immediate and
motivational impact. The concept of social networking is incredibly popular with young people. One very interesting tool is Twitter. It is a micro blogging tool, it is free to use and interestingly it is no longer being used by only
young people. There are lots of explanations for this. I think that adults got
to Twitter early, unlike ‘MySpace’ – which should really be called ‘TheirSpace’.
It just isn’t cool to hang out in the same place as adults. Twitter is a community of bloggers who, instead of writing for a webpage, write a short (up to
140 characters) description of what they are doing. This is then posted onto
a public time-line and by choosing whose tweet you see, you determine the
type of information that is pushed towards you. There are other aspects to
this brilliant C21st communication tool and you can be excused for perhaps overlooking them. The British media would have us all believe that
Twitter is a waste of time and that you have to be an absolute ‘Geek’ to want
120
Mathematics Education with Digital Technology
to use it. While I am sure that there are some outstandingly Geek-ish aspects
to Twitter as there will be with any social network, and at this very minute
there is someone commenting on the thickness of the butter being applied
to their piece of toast, these are not good enough reasons to dismiss
Twitter.
How can you use Twitter in the classroom? Simply by asking your followers
a question you can get real instant answers that you can use in your teaching. Any subject could beneit but let’s stick to maths; I know that some of
the early adopters of Twitter have used it to bring real-life statistics into class.
Simply by asking ‘how likely is rain today where you are?’, generates a lurry
of intense Tweeting activity and loads of useful data. Having location information available too allows learners to plot this information in Google Earth
or on a traditional map. The activity is real, relevant and relective and loads
of fun to do. The educator is then left to facilitate the information retrieval
and ensure the learning objectives are met. This is disruptive technology
and if you weren’t ready for it, this activity will turn your classroom upside
down, never a good enough reason not to do it even when the Inspector
calls! It isn’t going to work if your establishment bans Twitter. The activity
can be applied to lots of mathematical activities such as solving puzzles, getting help from experts, and collaborating with others in data rich projects.
Our Learning Platforms and Managed Learning Environments also have
the capacity to improve learning outcomes but only if they are used appropriately and not simply as a worksheet information store. John Davitt often
illustrates this point with a brilliant analogy between education and shopping. Why is it more acceptable that online shopping environments are
more developed than our online learning environments? When did you last
hear of a computer system offering the learner extension activities based on
their current level of interest? ‘Learners that found the Right Angled
Triangle interesting also found the Isosceles Triangle Interesting?’ Until
this is common we won’t have properly addressed the use of ICT in learning
and teaching.
I like technologies, or uses of technology, which challenge established
practice. It is not good enough that we continue to carry on doing what
we’ve always done without asking is this the best way for the learner to proceed. Collaboration is one of the most important survival skills for C21st
and it is a great shame that we don’t assess this skill or celebrate it in our
assessment of learners. Imagine turning up for a public exam with three
friends, a Net-book and a mobile phone and being welcomed in!
In combining some pretty traditional learning software for arithmetic,
for example, www.sums.co.uk, and a more radical use of your whiteboard
Home and School – Bridging the Gap
121
you can enhance the learning outcomes otherwise associated with them
separately. By turning your whiteboard through 90°, laying it lat facing up
on top of a table and by using a short-throw projector you have an interactive touch table surface that many learners can gather around without
standing in front of the projected image. By handing some of your technology over to the learners you shift the balance of power within the learning space and what you will see happen is just short of miraculous. Learners
will talk, share and take it in turns to touch the board. They will argue,
defend and explore new concepts and ideas but most importantly they will
be collaborating and learning together. You can buy some of this technology ready-made from Microsoft and also from Smart Technology or
from Matrix Displays with a ‘Vipro’ glass table, one of the biggest touch
surfaces available providing a 67-inch diagonal image.
Taking the class to the ‘ICT Suite’ can often be a traumatic experience,
for everyone! Whole class instruction using a room full of 30 desktop personal computers was never very satisfactory, except perhaps in the very early
days of ICT Suites. Now, learners have different and varied levels of expertise and it is almost impossible to instruct at a consistent level, without some
of the learners rushing off to explore different areas of the software you are
trying to use as a group. Instead the technology needs to come to you, to
your space and it can do that in the form of very inexpensive UMPCs (Ultra
Mobile Personal Computers). There are lots of brands to choose from with
some highly recommended ones starting at just £99. In my school of the
future, you wouldn’t be responsible for these either; I think laptop trolleys
have done more harm than good. It is now clear that your learners should
be able to produce UMPCs fully charged, ready to go and at any time they
are needed. Establishments that have done this by equipping young people
with this technology, and which have also empowered them to take control
of their maintenance, are beneiting from a truly transformational use of
ICT in all subjects. In real terms this means mains power available in learners’ lockers for recharging so this isn’t something that you can just bolt-on
quickly for the maths department, but it is something to aim for as a whole
organization.
Conclusion
Greater levels of transformation will occur when mathematics is merged
with other essential key subjects like science and engineering. Elsewhere in
this book you will ind references to the current STEM (science, technology,
122
Mathematics Education with Digital Technology
engineering and mathematics) strategy. This is an initiative designed to
encourage greater take up of each of these subjects, ideally through applying them together in realistic contexts. Obvious when you think about it,
really. This leads nicely onto data logging and some very interesting developments by Texas Instruments who continue to push the boundaries of
classroom calculator innovation, with some of their most recent products
looking more like mini-networking devices that allow content and material
to be shared and exchanged between learners. A data logging USB probe
can be easily attached and sensor data displayed and manipulated on the
same device. Educators can also ensure compliance with exam acceptance
as the TI-Nspire comes with a functionality reduction feature for use in
exam situations. The Teacher edition software also runs on a PC and has
Q&A functionality built in.
However you choose to use ICT in your learning and teaching spaces you
will ind that by empowering learners to take control of ICT you will free
yourself up to concentrate on the importance of really good maths
teaching.
Chapter 13
Personal Portable Technology
Adrian Oldknow
Emeritus Professor, University of Chichester, UK
Peter Hamilton
Head of Educational Development, Intel IT Innovation, Ireland, UK
Introduction
There’s nothing new about people wanting to have technological devices
that they can take around with them. The compass, pocket watch, slide rule,
sextant, telescope, camera, gramophone, transistor radio, cassette recorder
and pocket calculator were all artefacts which at their time made great
impact on society – many of which still survive. Now we are used to a compact battery-driven array of devices which include mobile phone, digital
organizer, digital still/video camera, MP3 music player, GPS navigation,
internet browser, e-mailer, radio/TV receiver, alarm clock, game station,
health monitor and laptop computer – often with several functions combined in the same unit. But their current impact on mathematics education, at least in the United Kingdom, is still more or less negligible. This is
about to change radically, at least in many developing countries and also in
most curriculum subjects, thanks to recent developments in technology.
Now as we look forward the rapid advance of Moore’s law continues
unabated which is doubling the power of computer microprocessors every
18 months while also reducing their price and power consumption is providing an increase in capacity and mobility never before seen in human
technological development. It is this change, mirrored in all components
of the modern mobile computer including storage capacity and screen
performance and cost, that is driving the constantly reducing price and
increasing portability of these devices. Even more rapidly, the available telecommunications bandwidth is increasing at double that pace with capacity
124
Mathematics Education with Digital Technology
at a given price point doubling every 9 months due to advances in the similar underlying physics of optical circuits and electronic switching technologies. Mathematicians will understand the impact of these two exponential
functions much more than the general public so we have no excuse for
being unaware of this great potential and the opportunity it presents for
our economies and societies. Before discussing the potential impact of the
new wave of personal portable technology we have a short review of what
has come before it.
A Short Review of the Past Three Decades
We have had cheap and portable, so-called four-function, and scientiic,
calculators widely available since the early 1980s, and yet it took nearly
20 years for them to be integrated into the English National Curriculum.
We have had graphical calculators available since 1986 (the Casio fx-7000g)
which at irst made some impact on post-16 mathematics teaching – with
the MEI, SMP and Nufield A-level schemes all integrating their use into
course materials. However, in a period of mathematical neo-Luddism
(2001–2006), the assessment scheme at AS/A2 was changed to ban the use
of graphical calculators in about half the examinations. Although this is no
longer case, and students may now use them in all examinations, it does not
appear that students currently receive the encouragement to use graphical
calculators is they did in the 1990s. We have also had symbolic manipulation
(CAS = Computer Algebra Systems) available in hand-held devices since
the mid 1980s (the HP-28g), but while many other countries have been
evaluating their use as a learning aid in mathematics, the English authorities have fought shy of grasping that nettle.
In 1993 the National Council for Educational Technology (NCET – precursor to Becta, the British Educational Communications and Technology
Agency) set up an ambitious Portable Computers in School Project with
projects involving primary and secondary school pupils in nearly every LEA
and curriculum area. So, for example, Hampshire LEA had a mathematics
project in three 11–16 secondary schools evaluating the impact of three different forms of technology. One school had suficient TI-81 and TI-85
graphical calculators for two parallel classes to use in pairs at the same time.
The TI-81 was, for its time, a very powerful device – but it lacked any form
of I/O (input and output) and so could not be projected, or plugged into
a computer or printer. The TI-85 was more expensive but could be connected to an LCD display panel for whole class projection, and could
Personal Portable Technology
125
exchange data between units, as well as with computers and printers. At
that time compatible data loggers were not yet available. Another school
had a set of 15 laptop computers, which were then heavy, very expensive,
had a relatively short battery life between recharges and had a weak spot
where the power cable was plugged in and out. These could be used for
whole class display with a large colour monitor. The third school had a set
of 30 HP-95 palm-top computers with built-in graphing software, a spreadsheet and the Derive mathematical software on a memory card. Thus a
whole class was equipped with these for a year, and students were able to
take them to all lessons and keep them at home after hours and during
vacations. There was no means of whole class display, but there was a serial
cable for connection to PC and/or printer. Students quickly started using
the calendar and word-processing functions for keeping homework diaries
and writing up notes from other lessons. It is interesting to see in many ways
how little things had moved on in term of the integration of portable Information and Communications Technology (ICT) in schools in the 10 years
from then until the 2003 Becta research report (Becta 2003).
The DfES Maths Alive! research project (2000–2001), reported on by
Don Passey in Chapter 6, deliberately went for a ‘mixed economy’ where
the teachers at 20 pilot sites had laptops and printers, the classroom had 3
or 4 desktop PCS and a ceiling mounted projector together with an analogue interactive whiteboard, and there was also a set of TI-83 graphical
calculators for use in pairs on students’ desks. The teachers also had TI-83s
for projection with the LCD pad as well as a data logger: a TI-CBR for collecting distance-time data. Thus teachers had considerable lexibility in the
kinds of ICT tools they could deploy – but, perhaps not surprisingly, most
preferred to work in a whole class, teacher-led fashion (Passey 2005).
Professional associations such as the Association of Teachers of Mathematics and the Mathematical Association, and groups such as Teachers
Teaching with Technology (T3), have provided support and encouragement for mathematics teachers to provide hands on access to ICT including
the use of graphical calculators, and video case studies produced by the
DfES (now DCSF) illustrated their use in classrooms. While some of these
materials are now getting rather dated – at least in terms of the fashions
worn in the photographs – their content remains just as relevant now. See,
for example, the Becta book on data logging (Oldknow and Taylor 1998).
A more up-to-date source is the learners’ entitlement document (Becta
2009). In general, though, there has been little incentive for mathematics
teachers to provide hands on access to ICT – except, that is, until the
compulsory ICT-based coursework task for data-handling in GCSE
126
Mathematics Education with Digital Technology
mathematics was abolished. This is in stark contrast to the way personal
technology has been integrated into the International Baccalaureate.
Tentative Steps
For a while it appeared that a technology known as the PDA (Personal Data
Assistant) might hold the key to getting hand-held learning widely adopted.
Wolverhampton LEA piloted a project using PDAs in four primary schools
in 2003. Parents bought the devices for their children under a lease-lend
scheme – and so the pupils could use them at school and at home. While
they had a limited number of educational applications available, the PDAs
were used extensively as web-browsers, as well as cameras, and pupils were
able to produce project presentations: www.learning2go.org/.
Internationally Nicholas Negroponte from the Massachusetts Institute of
Technology launched a $100 laptop computer, The Children’s Machine, in
November 2005, designed for students in the developing world. This provided a challenge to the ICT industry to produce high-speciication, ultraportable but rugged devices suitable for education worldwide. An early
example of this was Intel’s irst Classmate PC from 2006 which was piloted
in South America and Southern Africa as part of their World Ahead
Program.
A different approach has been taken in the development of the TI-Nspire
hand-held device. Closer in price to a graphical calculator, the TI-Nspire is
not designed as a web-browser, but has its own integrated mathematical
equivalent of Ofice software, in which a document can consist of several
pages which might contain calculations, graphs and geometry, lists and
spreadsheets, data and statistics, notes, data-capture from sensors, and so on.
Files can be exchanged between units, and with computers. In the classroom
several units can be connected to the computer at the same time, and there
is also a new classroom wireless network system, TI-Navigator. There is a software emulator for the hand-held which runs on Windows and Mac computers and which can therefore be used for whole class displays. A pilot
project using TI-Nspire in seven secondary schools in England was completed
in 2008. The project evaluation report is available (Clark-Wilson 2008). Activities from the project are available too (Clark-Wilson and Oldknow 2008).
Increasingly UK schools are issuing Windows laptops to students, and we
are fortunate that in mathematics there is already a very powerful and
appropriate software base to support personal learning. Many schools used
the opportunity provided by the so-called ‘e-Learning credits’ to purchase
Personal Portable Technology
127
site-licences of software such as Autograph, Geometer’s Sketchpad, Cabri, and so
on, even if they have not been used extensively to date. Most laptops have a
spreadsheet installed – either MS Excel or Open Ofice, and there is a range
of powerful free, or very cheap, software to support mathematics, such as
Geogebra,the MA/Intel Skoool Mathematical Toolkit, Tracker and Vernier’s
Logger Pro.
The Tipping Point
At the Hand-held Learning conference in London in October 2007, the UK
educational ICT company, Research Machines plc, announced the irst
Asus minibook PC for under £200. Within the last 2 years we have seen a
plethora of ever more powerful such ultra-portable notebook PCs arrive on
the market with prices between £200 and £300, about a tenth the cost of the
irst laptop computers! Most of these are now preloaded with a version of
Windows, normally XP.
In January 2009, Intel announced their third generation of the Classmate
PC, as a tablet PC with a touch sensitive screen. In the United Kingdom it is
sold through a company called Zoostorm, and the current top of the range
model, called the Fizzbook Spin 10.1” PC, is powered by a new Intel Atom
processor: www.besa.org.uk/besa/news/view.jsp?item=2197
Like the Apple I-phone it has accelerometers inside which detect whether
it is being held in landscape or portrait mode. It is also equipped with an
integrated camera and wireless internet connection as well as a 60Mb hard
drive and Windows XP. At around £300 ex-VAT it is currently being evaluated
by members of the Association for Science Education (ASE) and the Mathematical Association (MA) as a baseline platform to support secondary school
(11–18) maths, science and STEM teaching and learning. In addition to the
mathematical software already mentioned (e.g., TI-Nspire, Autograph,
Sketchpad, Cabri, Geogebra, Mathematical Toolkit), there are statistical tools
(Fathom), modelling tools for science (Modellus, Tracker), physics simulations
(Algodoo), data logging tools (Logger Pro, Coach) and programming environments (Alice 2.2). Used in conjunction with USB and wireless sensors
(Vernier, TI), as well as high speed cameras (Casio Exilim EX-FH20), we have
an undoubted Rolls-Royce of the ICT world at the price of a Model T Ford!
Intel is now working with a group of UK and Irish maths and science educators to develop other forms of simulations and interactive environments to
support innovative teaching and learning approaches, which include support for robotics (Lego Mindstorms) and digital prototyping (Arduino).
128
Mathematics Education with Digital Technology
It’s a digital world for students – let’s get it joined up
Anyone who has come into contact with youngsters, say 3–7 years old, cannot help but notice the speed with which they pick up the use of technology –
particularly that associated with video games and watching TV. Older
students already make extensive use of technology such as the web and
Personal Portable Technology
129
mobile phone for texting, Skyping, Twittering, blogging, podcasting, sharing photos and videos, social networking and other such absorbing pastimes. They can certainly be forgiven for not making connections between
any of these activities and the aspects of maths, science, technology and
engineering which make them possible. Similarly, given the bewildering
pace of technological innovation, it is not surprising that most of those
involved in teaching them are also unaware of these connections.
It could be argued that most secondary school mathematics departments
are now equipped with suficient ICT tools (laptop, printers, internet access,
data projectors, IWBs, learning platform) to support their teaching needs
with the current curriculum. The loodgates opening up with latest educational ICT advantages give us the opportunity to concentrate on fulilling
the needs of the learner. Of course we can provide them worksheets to complete, or videos to watch, just as we have done for many years, but the real
challenge is to ind ways to use the ICT to excite their interest and involvement in learning – and awaken their curiosity in mathematics – as well as
science and STEM. The trouble is that we don’t have experience in doing
this! But perhaps that is all for the better if we want to engage learners more
actively in taking shared responsibility.
We already have some good examples of what to do with digital images.
For example, photo and video editors provide their own mathematical
environment within which transformations such as relections become ‘lip
vertically’ and ‘lip horizontally’. You can rotate and enlarge images, and
interpret a variety of measurements, such as pixels, mm, frames per second,
in making things it. Digital images, such as Richard Phillips’ ‘Problem Pictures’ can be projected to prompt mathematical discussion – but students’
(and teachers’) own images can also be used for that purpose, such as
bringing a lesson on symmetry to life. Digital images can be introduced as
the background for graphing and/or geometric construction in software
including Autograph, Cabri II Plus, MS Excel, Geogebra, Geometer’s Sketchpad,
Mathematical Toolkit. Video clips can similarly be used as stimuli. Displayed
on an IWB, points can be ‘captured’ as the clip is single-stepped, and conjectures made about the path of a moving object. With software such as
Coach, Logger Pro, Mathematical Toolkit and Tracker students can capture and
model data from videos of their own activities, such as throwing a netball,
or bouncing on a trampoline. The new range of digital cameras with high
speed video mode allows movements to be captured which could not be
seen with the naked eye.
Animations, cartoons and computer games use graphical techniques for
virtual reality based on computer graphics (applied geometry) techniques
originally developed for computer aided design (CAD) – such as Bézier
130
Mathematics Education with Digital Technology
curves – and many of these are quite accessible applications of school geometry, algebra and calculus. They also use so-called ‘physics engines’ so that
things appear to move according to physical laws. (Just look at the amazing
love scene in space in Pixar’s WALL-E cartoon where one igure uses squirts
of a ire extinguisher as his power pack.) It’s just as important for students
to be aware of the entertainment applications of maths and science as it is
for the obvious disciplines of engineering, rocket science, and so on. These
are certainly major sources of employment for mathematics and physics
graduates – so even work can be fun (or Phun qv).
Mobile phones, Sky TV, GPS and the internet all rely on satellites in
geostationary orbits launched by rockets such as the European Ariane. Sky
TV is received by a parabolic dish which focuses rays through a collector in
the same way as an optical telescope does. Journeys on foot, bike or car can
recorded on GPS devices such as Garmin and the resulting data retrieved
for analysis, for example, in Excel and Logger Pro, but also directly into
Google Earth and Google maps, showing data such as speed, time, direction and altitude. GPS and other data logging devices, such as accelerometers, heart monitors, temperature gauges, radar guns, and so on can be
used to record students’ athletic exertions such as long-jumping, javelin
throwing, running – and correlated with, for example, video data to model
motion. The Nintendo-Wii games console already uses wireless data logging together with maths, physics and biomechanics to record a player’s
motions and to predict its effect on an abject, such as rolling a ten-pin ball,
hitting a golf shot or kicking at goal. The Microsoft system uses a pair of
stereo cameras as an alternative. We can expect to see many applications of
this kind of technology in the future.
If we can come up with interesting and challenging tasks and ideas for
students to pursue, alone or in groups, we can also provide them with
opportunities to practice and improve their communication skills in conveying their indings.
Conclusion
On 19 April 1965 Electronics Magazine published a paper by Gordon Moore
in which he made a prediction about the semiconductor industry that
has become the stuff of legend. Known as Moore’s Law, his prediction has
enabled widespread proliferation of technology worldwide, and today has
become shorthand for rapid technological change. Today Moore’s law
continues to apply to the communications and computing industry where
131
Personal Portable Technology
Moore's Law Graph - 1965
105
Relative manufacturing cost
per component
1962
1965
104
1970
103
102
10
1
10
102
103
104
105
Number of components
per integrated circuit
computing and memory capacity doubles every 18 months. Any fan of
digital photography will have seen an almost 100-fold increase in memory
card capacity at a given price point over the past 9 years from 64Mb to now
4Gb and above as standard. The increase in internet bandwidth driven by
the same underlying microprocessor and optical physics is actually increasing at a rate that is twice as fast as Moore’s Law, with bandwidth at a price
point doubling every 9 months. We have seen connection speeds increase
from 56 kbps dial-up less than 10 years ago to speeds for 40 mbps projected
for WIMAX connections and 4G mobile connections over the next 12 to 18
months. The implications of this rapidly increasing capacity are far reaching with computing technology moving from being scarce to becoming
abundant resources which are ‘too cheap to meter’. We are only part way
through this dramatic and fundamental transformation in widespread
access to computing power.
Such developments in technology are producing an increase in availability and access to devices, content and communications at growth rates never
previously seen in any industry or human activity in history. The continued
advances in physics underlying the rapid advancement in semiconductor
and communications technologies, together with the explosion of open
content and software, are driving fundamental social and economic changes
(Anderson 2009). It is critically important that our young citizens and
132
Mathematics Education with Digital Technology
members of the future workforce are using these technologies to learn,
problem solve, innovate and take a leadership position in the modern smart
economy – see (Oldknow 2009). Much will depend on whether we have the
skills, and will, to maximize this opportunity for advances in education.
How much do we risk if we fail to do so?
References
Anderson, C. (2009). Free: The Future of a Radical Price. London: Random House.
Becta. (2003). What the Research Says about Portable ICT Devices in Teaching and
Learning. Becta: www.education.gov.uk/publications/standard/publicationDetail/Page1/15002 (accessed on 5 February 2011).
—(2009). Secondary Mathematics with ICT: A Pupil’s Entitlement to ICT in Secondary
Mathematics. Becta: www.teachernet.gov.uk/_doc/13781/entitlement_sec_maths
.doc (accessed on 5 February 2011).
Clark-Wilson, A. (2008). Evaluating TI-Nspire in Secondary Mathematics Classrooms.
University of Chichester: www.chi.ac.uk/teachered/documents/Clark-Wilson
2008TI-NspireFinalReportv5.pdf (accessed on 5 February 2011).
—and Oldknow, A. (2008). Inspiring Maths in the Classroom. Texas Instruments:
http://education.ti.com/sites/UK/downloads/pdf/Inspiring_Maths_in_the_
classroom.pdf (accessed on 5 February 2011).
Moore, G. (1965). Moore’s Law. Intel: www.intel.com/technology/mooreslaw/.
Oldknow, A. (2009). Their world, Our World – Bridging the Divide. Teaching Mathematics and Its Applications V28 N4, 180–95 December.
Oldknow, A. and Taylor, R. (1998). Data Capture and Modelling in Mathematics and Science. www.adrianoldknow.org.uk/datacapture.pdf (accessed on 5 February 2011).
Passey, D. (2005). Maestro: MathsAlive Evaluation Study. Lancaster University: www.
rm.com/_RMVirtual/Media/Downloads/Final_Maestro_Project_Paper.
pdf(accessed on 5 February 2011).
Part Five
Practical Ideas of ICT to
Enhance Teaching and Learning
In this section, a selection of writers, who are engaged with teachers in various capacities, outline some of the Information and Communications Technology (ICT) rich resources that are available to enhance classroom
practice. Many of the resources referred to are freely available. A small
number require a subscription fee, but these are included as they are representative of a wider set of websites and resources and are available in
many schools.
Chapter 14
Linking the Mathematics Curriculum to
Software, Resources and Strategies to
Engage Teachers and Learners in
Using ICT in the Classroom
Linda Tetlow
Consultant
Introduction
In the autumn of 2003, after a 2-year break from mathematics teaching, I
took on a new role as mathematics coordinator for a new and innovative
project for online ‘Out of school learning’. I have always been interested in
using ICT to enhance mathematics teaching and learning and looked forward to both the opportunities and the challenge that teaching in an interactive online classroom would present. As coordinator I was required
initially to prepare a programme of study for the students whose ages, mathematical background and reasons for being educated out of school varied
considerably. Then I needed to prepare and upload my own lessons and
materials, together with some prepared lesson plans and materials that
could be used by other teachers. There were two principal challenges:
z
z
Preparing my own materials that could be used in the on-line classroom
using the facilities available and that would engage a range of learners,
some quite reluctant. This might be using a very simpliied interactive
whiteboard which had the facility to grab snapshots of documents and
web pages, using uploaded PowerPoint presentations and application
sharing some software such as spreadsheets, graphing packages or
dynamic geometry.
Finding interesting resources that were available on the internet that we
could share in the classroom to save time-consuming preparation and
that could be used by the other teachers.
136
Mathematics Education with Digital Technology
Despite trying to maximize the use of the available internet resources, because
constantly preparing and uploading my own materials was very time consuming, I really struggled to ind a good range of interesting and motivating material and certain mathematical topics were especially problematic. For example,
anything 3-dimensional was dificult for students to interpret on a 2D whiteboard. I was working very much in isolation mathematically, although sharing
general strategies with coordinators of other subjects, and would have welcomed opportunities then to share ideas with other mathematics teachers.
In the years that have followed I have had several opportunities to work with
a variety of mathematics educators who share the belief that the use of digital
technologies is an important part of teaching and learning mathematics and
who have come together to pool their knowledge of where to ind resources
and how to use them in the classroom. There are lots of ideas, software and
resources that I now know about and could use in a ‘real’ or ‘virtual’ classroom. The result of this more recent work has led me to two conclusions.
z
z
The world has moved on since 2003–2004 and there are now far more
resources available to mathematics teachers both software and internet
resources. Additionally the increased speed and widespread availability
of internet access has opened up enormous possibilities for teachers,
learners and educators to use and share this software and resources.
As a teacher working in isolation mathematically I could not possibly have
discovered all that was available. Some means of consolidating shared
information, linking it to aspects of the mathematics curriculum and making this information available for all teachers to access easily is essential.
I had the opportunity to do this when I helped to coordinate the work a
group of mathematics educators who attended a 2-day brainstorming session. The purpose of this session was to share ideas about useful ICT
resources and classroom tested ideas and strategies and to link these to
particular areas of the mathematics curriculum with an emphasis on 14–16
year olds. The ‘ICT enriched curriculum grid’ which links the curriculum to
activities and resources involving the use of ICT is available by joining the
National Centre for Excellence in Teaching Mathematics (NCETM) website. Once you have joined and logged in, select ‘community’, then ‘view all
communities’, and then ‘ICT in Mathematics’. You need to apply to join the
community but any logged in users of the site can do this. Finally select the
documents tab and ‘BECTa ICT products’.
The new mathematics curriculum in England (2007) lists under ‘Curriculum opportunities’ that pupils should ‘Become familiar with a range of
resources, including ICT, so that they can select appropriately’ and expands
Mathematics and ICT in the Classroom
137
on this to say that ‘This includes using practical resources and ICT, such as
spreadsheets, dynamic geometry, graphing software and calculators, to
develop mathematical ideas’.
I have included in what follows a selection of ideas which I hope show the
potential of ICT to enrich the curriculum and to provide opportunities for
work which would be very dificult without it. I have tried to include
examples which include a wide range of tools and resources and include a
variety of areas of the mathematics curriculum. Wherever possible the
examples shown are linked to further information which includes possible
lesson materials and classroom resources, help with using software and in
some case to actual examples of classroom use by both experienced and less
experienced practitioners.
Objective: Work on Tasks That Bring Together Different
Aspects of Concepts, Processes and Mathematical Content
In this case:
z
z
Number and Algebra – Graphing straight lines and gradients
Geometry – Properties of 2D shapes; Points, lines and shapes in 2D
coordinate systems
Match the Graph
In this activity students use a graphing package or graphical calculators to
input equations of straight line graphs to match a given image. For example,
to form the shape of a kite or a parallelogram:
138
Mathematics Education with Digital Technology
Using the graphical calculator or graphing software enables the pupils to
generate and explore graphs of linear functions quickly thus enabling them
to focus on the key properties of the functions and how they can be used to
create geometrical shapes with particular properties.
This task is 1 of a set of 28 activities in the ‘Practical Support Pack’ which
includes lesson plans, classroom resources and practical advice and was
developed with the support of The Mathematical Association. They cover a
wide range of mathematical content and provide opportunities for pupils
to develop their problem-solving skills, mathematical strategies and thinking skills.
Objective: Visualize and Work with Dynamic Images
Visualizing in 3 Dimensions
This can be very dificult without the aid of models, at least initially. It is easy
to underestimate the dificulties of interpreting 2-dimensional representations of 3D objects and the misconceptions that can arise from these.
3-dimensional dynamic geometry software such as the powerful Cabri 3D, or
the simpler Yenka 3D shapes, offer the facility to construct solids quickly and
to open them to reveal their nets or to rotate the viewing angle using the
mouse to view them from different directions. These are some examples:
z
z
Visualizing right-angled triangles in order to use Pythagoras’ theorem or
trigonometry in 3D
Visualizing plans and elevations of a 3D object
Mathematics and ICT in the Classroom
z
139
Constructing nets of common solids and visualizing which edges or
corners connect
An example of Cabri 3D being used in the classroom is shown in the
Teacher’s TV programme ‘Hard to teach – secondary Maths using ICT’.
The lesson shows a classroom where pupils are trying to ‘Find the length of
the longest stick that will it into a cuboid’. In this video pupils are using the
software on an interactive whiteboard linked to a single computer. There is
more information about this lesson activity in the ‘Inspire me’ section of
the BECTa website. This lesson can also be seen, together with further
information, activities and links to on-line tutorials on the Cabri website. A
different classroom set up and activity is shown in an overview video which
can also be viewed on the site.
There are also some very useful applets available on the internet for speciic 3D applications. The Standards unit pack ‘Improving Learning in Mathematics’ is a multi-media resource which has activities that encourage
learners to become more independent and relective about their mathematics. The pack includes an activity Building houses which allows students
to explore connections between 3-dimensional models and their plans and
elevations, using the mouse to rotate the view. The applet and a more
challenging one ‘Building houses with side view’ are also available from the
Freudenthal Institutes’ Wisweb site together with a number of other useful
applets (follow the ‘applet’ link).
Objectives: Visualize and Work with Dynamic Images; Make
and Justify Conjectures and Generalizations
Manipulating in 2 Dimensions
One advantage of using dynamic geometry software such as Cabri Geometry 2
plus, the Geometer’s sketchpad or Geogebra is that it allows you to drag points on
geometric objects and to quickly be able to make and test conjectures and
generalizations about properties which remain constant, such as angles
which remain equal or shapes that retain their properties for example,
parallel sides. One example of this is in exploring properties of angles in
circles, and this can be seen in action in the classroom in the Circle Theorems
lesson within the Teachers’ TV programme ‘Hard to teach secondary Maths
using ICT’ with additional information available from the ‘Inspire me’
section of the BECTa website.
140
Mathematics Education with Digital Technology
Further Resources
There are many resources available to support teaching and learning using
dynamic geometry software.
z
z
z
A selection of iles is available in the BECTa section of the CD ‘Integrating ICT into the Mathematics Classroom’ published by ATM
The websites for dynamic geometry software (Cabri Geometry II plus, The
Geometer’s Sketchpad, Geogebra) all have additional help and support
information
There are two Teachers TV programmes which show dynamic geometry
in action
z
z
z
KS3/4 Maths – Using Dynamic Geometry has classroom sessions
showing how dynamic geometry software can help pupils better engage
with learning mathematical concepts by interactive demonstrations,
constructions and explorations and
KS3/4 Maths – Demonstrating Dynamic Geometry in which a Maths specialist teacher demonstrates a variety of ways in which dynamic geometry
software can transform the teaching of mathematical concepts.
Adrian Oldknow’s website has many examples of dynamic geometry in
action.
Objective: Apply Suitable Mathematics Accurately within the
Classroom and beyond; Identify the Mathematical Aspects of
a Situation or Problem; become Familiar with
a Range of Resources, Including ICT
The ‘Playground Maths’ Project
This uses images of roundabouts, swings and slides as contexts for work on
a variety of mathematical topics. The initial trial of this activity with Year 10
was quite structured with speciic tasks for each piece of equipment. The
teacher went on later with a different class to set a more open task to
‘Investigate the mathematics that you can ind in a playground’. A visit to the local
playground gave students the opportunity to take digital photographs using
cameras or mobile phones and to take measurements. The photographs
were imported into Dynamic geometry software which was then used to
measure distances, angles and gradients. Graphic calculators were also used
for equations of linear graphs.
Mathematics and ICT in the Classroom
141
142
Mathematics Education with Digital Technology
The Swing
A video clip of a swing in action was inserted into open source video analysis
software (Tracker 2) and students investigated the loci that a particular
point on the swing traced out as the swing moved. The software allowed
them to collect data for the coordinates of points on this path. A still, showing the coordinates, was pasted into dynamic geometry which was then used
to ind the locus of the path of the swing and the distance travelled.
The Slide
An image of a slide was imported into dynamic geometry software and scales
adjusted to match known measurements. This enabled other lengths, angles
and gradients to be estimated.
The mathematics department in this large comprehensive school makes
extensive use of the school’s VLE to share activities between staff and to
show students’ work. The Year 10 class (set 3 of 5) produced a movie on
DVD with the aid of the school technician. They showed how they could
extract various aspects of mathematics from the playground equipment.
They scripted the movie themselves and helped to edit it. The students also
used screen capture software to make a video showing other students and
staff how to use the video analysis software.
With the irst class, the teacher was able to book a school computer room,
while the video clip of the second class shows them using a class set of laptops which are available on a portable trolley.
This case study is one of those described in the QCA ‘Engaging mathematics for all learners’ project and there is also a short video clip about
this activity ‘Swings and Roundabouts’ on the QCA curriculum website at
First select ‘case studies’ and then ‘mathematics’. A Teachers TV programme will also be available shortly.
Some Additional Sources of Information and Resources
z
z
Some of the initial images of slides were from the Problem pictures CD
from Richard Phillip’s website.
There is also a selection of these images on the CD that accompanies the
book Integrating ICT into the Mathematics Classroom published by the ATM
(2005). The ‘Maths Gallery’ on this CD includes images of ‘Straight lines
and gradients’, ‘U-shaped curves’ and ‘Waves and other curves’ which
Mathematics and ICT in the Classroom
z
z
z
143
can be inserted into dynamic geometry or graphing software so that students can experiment itting graphs of functions.
The MA website has a link to a booklet offering advice on maximizing
the potential of the interactive whiteboard which includes using images
of slides with IWB mathematical features.
The free Mathematical Toolkit software also allows for modelling with both
still and moving images and comes with a small library of both still images
and video clips.
Jing is free screen capture software which allows users to make short clips
and to share them with others. More professional versions are available
from links on the web page.
Objective: Engage in Mathematics as an Interesting and
Worthwhile Activity; Take Account of Feedback and
Learn from Mistakes
Distance-time Graphs
This is one of the lessons featured in the Teachers TV programme KS3/4
Maths: New Maths Technology – In the Classroom. In this programme a
mathematics department embarks on a project to make better use of ICT
in the classroom. The teachers are introduced to some of the new technology and then try out their newly-acquired skills. In particular, a lively Year 8
group has fun trying to recreate particular shaped distance time graphs
time by moving in front of a data plotting range-inder (the Texas Instruments CBR2). This activity enables pupils to make direct links between
their movements and the shape of the graph and to avoid many misconceptions which pupils traditionally have about these graphs. The single range
inder can be linked to a graphical calculator with an OHP link or to a PC
with software such as a graphic calculator emulator (TI84 emulator) or TI
Nspire software.
Further Information and Resources
z
z
‘Real time distance time graphs’ is one of the activities in the Practical
Support pack’s mathematics section
Texas Instruments have a wide range of information, resources, research
indings and classroom support materials available from their websites.
144
z
z
Mathematics Education with Digital Technology
Further information about this and other data logging activities can be
found in the Becta book: Data-capture and modelling in mathematics and
science which is available to download from page 2 of Adrian Oldknow’s
website
The other lessons included in the TTV programme are:
z
z
z
Year 7 investigate algebraic expressions using an interactive number
line. This is a free resource from Skoool available to download from
the London grid for learning.
Year 9 explore rotational symmetry with dynamic geometry software
Year 10 investigate a problem using graphical calculators
Objective: Work on Problems that Arise in
Contexts beyond the School
Work with the handling data cycle: Specifying the problem and planning;
collecting data; processing and presenting the data; interpreting and discussing the results
There is a wealth of data available on the internet which enables the making and testing of statistical hypotheses relating to large data sets without
the time consuming process of collecting and organizing the data. The use
of real world data and topical contexts adds a richness and relevance to the
activity. One of the schools in the QCA ‘Engaging mathematics project’
made use of data from a fast food restaurant chain to make and test hypotheses relating to the fat, salt, sugar and calorie content of different categories
of meals.
Further Resources – Activities and Data Sources
z
z
z
QCA – RSS Centre Review of Handling Data and Statistics in GCSE Mathematics consists of 8 case studies with teachers’ notes and links to appropriate data sets
The Practical support pack has a range of activities with teacher notes, lesson plans and resources. These include ‘Population and development database’ and ‘Wrist and neck sizes’
CensusAtSchool: is an International Children’s Census collecting and
disseminating real data for use by teachers and pupils in data-handling,
ICT and across the curriculum for learning and teaching.
Mathematics and ICT in the Classroom
z
z
z
145
Stats4schools: this website aims to help teachers and pupils to get more
from statistics. For pupils, there are datasets to download and include in
projects. For teachers, there are lesson plans and worksheets.
Experiments at school: This website has a number of experiments to
carry out and collect data which can then be analyzed. It includes a reaction timer. Further ideas and another reaction timer are on the NRich
website.
Further ideas for data-handling activities and sources of data can be
found in the ‘ICT enriched curriculum grid’ described earlier and available
in the documents folder of the ‘ICT and mathematics community’ on
the NCETM website.
Objective: Recognizing the Rich Historical and
Cultural Roots of Mathematics
This activity was developed initially by teachers with the help of internet
research. Subsequently their students were given opportunities to do similar research on aspects that particularly appealed to them.
The Golden Ratio Project
One school tackled an extended project on the Golden Ratio and Fibonacci sequence for the entire Year 10 cohort over a 2-week period. Details
of this are included in the guidance booklet for the QCA ‘Engaging mathematics for all learners’ project. Two teachers prepared a variety of activities
and resources. The teachers used ideas that they had collected from various
sources including the NRich project website and Dr Ron Knott’s website.
There were more activities than the time available to give teachers and students the opportunity to choose between activities. They included: (1) a
variety of constructions with instructions for doing them on paper or using
dynamic geometry software; (2) statistical tasks looking for the existence of
the Golden Ratio in the human form and (3) opportunities for students to
do their own further research.
The students found the topic particularly intriguing and welcomed the
opportunity of the further internet research to pursue topics that particularly interested them. They made good use of the schools VLE to post their
ideas and comments.
146
Mathematics Education with Digital Technology
One inal note, the problem with citing links to websites is that they frequently change! The links were correct at the time of writing, but if any
cease to work, then the ‘Wayback Machine’ often proves helpful in locating
websites and resources that have disappeared.
Websites
All websites accessed on 5 February 2011.
Adrian Oldknow’s website http://www.adrianoldknow.org.uk/
ATM www.atm.org.uk/buyonline/products/rea025.html
Becta (Inspire me) http://schools.becta.org.uk/index.php?section=cu&catcode=
ss_cu_ac_mat_03
Cabri Geometry II plus www.cabri.com/cabri-2-plus.html
Cabri 3d (software) www.cabri.com/download-cabri-3d.html
Cabri 3d (software overview video) www.cabri.com/bett-awards.html
Cabri 3d (diagonal of a cuboid lesson) www.cabri.com/cabri-3d.html
CensusAtSchool www.censusatschool.ntu.ac.uk/default.asp
Dr Ron Knott’s website www.mcs.surrey.ac.uk/Personal/R.Knott/Fibonacci/
Experiments at school www.experimentsatschool.org.uk/main/
Freudenthal Institutes’ Wisweb www.i.uu.nl/wisweb/en/
Geogebra www.geogebra.org/cms/
The Geometer’s Sketchpad www.dynamicgeometry.com/index.php
Jing www.jingproject.com/
Mathematical Association (Interactive Whiteboard advice) www.m-a.org.uk/jsp/
index.jsp?lnk=140
Mathematical Toolkit http://lgl.skoool.co.uk/common.aspx?id=901
NCETM www.ncetm.org.uk/
NRich (Golen ratio) http://nrich.maths.org/public/search.php?search=Golden+ratio
NRich (Reaction timer) http://nrich.maths.org/public/search.php?search=
Reaction+timer
Practical Support Pack www.teachernet.gov.uk/wholeschool/ictis/cpd/practical
supportpack/
Problem pictures (Richard Phillips) http://www.problempictures.co.uk/index.htm
QCA – RSS Centre Review of Handling Data and Statistics in GCSE Mathematics
www.rsscse.org.uk/qca/resources0.htm
QCA (curriculum website) http://curriculum.qca.org.uk/key-stages-3-and-4/index.
aspx
Skoool http://lgl.skoool.co.uk/common.aspx?id=901
Stats4schools www.stats4schools.gov.uk/default.asp
Teachers’ TV (diagonal of a cuboid/Circle theorems lessons) www.teachers.tv/
video/29853
Teachers’ TV (KS3/4 Maths: Demonstrating Dynamic Geometry) www.teachers.tv/
video/3080
Teachers’ TV (KS3/4 Maths: New Maths Technology) www.teachers.tv/video/154
Teachers’ TV (KS3/4 Maths: Using Dynamic Geometry) www.teachers.tv/video/3081
Mathematics and ICT in the Classroom
147
Texas Instruments http://education.ti.com/educationportal/sites/UK/homePage/
index.html
Tracker 2 www.cabrillo.edu/~dbrown/tracker/
Wayback Machine www.archive.org/index.php
Yenka http://www.yenka.com/
References
ATM. (2005). ‘Integrating ICT into the Mathematics Classroom’ ( Derby, UK, Association
of Teachers of Mathematics www.atm.org.uk/buyonline/products/rea025.html
(accessed 5 February 2011).
DfES. (2005). Improving Learning in Mathematics, Standards Unit http://tlp.
excellencegateway.org.uk/default.aspx#math_learning (accessed 5 February
2011).
QCA. (2009). Engaging Mathematics for All Learners www.qcda.gov.uk/22223.aspx
(accessed 5 February 2011).
Chapter 15
The Uses of Online Resources for
Teaching and Learning Mathematics at
Advanced Level
Bryan Dye
Consultant
Introduction
In this chapter we look irst at the background to online learning, secondly
at the kinds of tools and technologies available online, thirdly at how three
particular websites are providing resources for A Level mathematics, and
lastly at the intended users of these resources.
Background
Teenagers nowadays are sophisticated users of the internet. In the United
States four years ago it was estimated that about 87 per cent of teenagers
between 12 and 17 were online. The Guardian newspaper recently reported
on research revealing that 65 per cent of teenagers are streaming music
regularly, with more 14- to 18-year olds (31%) listening to streamed music
on their computer every day compared with music fans overall (18%). The
BBC is promoting its online Iplayer concept. In January this year 26 per
cent of 14- to 18-year olds admitted ilesharing at least once a month. Older
people among us may still be wondering what ‘ilesharing’ actually is. The
point is that teenagers will expect a lot from their internet resources and
take a lot for granted. A few helpful notes, even an online textbook is no
good; interactivity is the key, ranging from video clip and games to fully
controllable functionality. In any case, it can be argued that the textbook,
having once been scanned into a computer and then left for dead, has now
The Uses of Online Resources
149
evolved into the web phenomenon that is the wiki. According to Wikipedia,
a wiki is a type of collaborative software program that typically allows web
pages to be created and collaboratively edited using a common web browser.
Websites running such programs are themselves referred to as wikis. A
search on the web for information on virtually any topic will usually throw
up a link to a wiki within the irst half dozen references. This is what young
people are becoming accustomed to; interactivity to them no longer has
any ‘wow’ factor, it is expected.
Online Interactivities
The variety and degree of interactivity available on-line is increasing steadily.
Whereas a few years ago educational sites may have offered little more than
text, now there is a myriad of interactivity utilizing technologies such as
Flash, Java, Javascript, PHP, forums, conferencing and video. Recently the
browser Firefox, in version 3.5, has enabled the embedding of video directly
into a web page with out the need for any special display software. The web
is rapidly approaching the point where full interactivity is accessible to all.
So, what is available to the advanced level mathematics student? Mathematics seems to me to be ideally suited to the web. The student can investigate
graphs, geometrical constructions, algebraic manipulation, logical thinking, calculus, mechanics, statistical diagrams, simulations, video, and so on.
Some of these interactivities have been born and bred solely on the web,
interactive geometry being a good example. On the one hand proprietary
software such as Cabri Geometre, Geometer’s Sketchpad or Autograph
have developed their own on-line versions; on the other hand new packages
150
Mathematics Education with Digital Technology
such as GeoGebra (have come about purely on the web. In the relatively
short time that it has been around, Geogebra has integrated algebra with
geometry and recently spreadsheets, developed its own support forum and
its own ‘wiki’. Organizations like The Association of Teachers of Mathematics and the Further Maths network in this country and the Mathematical
Association of America in the USA are looking closely at what this kind of
software can offer. Other online interactive packages include JavaMath or a
recent update of it WebCompMath (both of which present the user with
interactive graphs whereby the effect of a change in parameters (using an
slider) on the shape of a curve may be observed. The graphs may be polynomial, parametric or polar. Differentiation, integration or composition of
functions can be investigated also in this same environment. Online spreadsheets have come of age with Zoho (http://sheet.zoho.com/)
The correct display of mathematical notation has in the past been an issue
for web authors, whereby fractions, indices and matrices have been displayed in a primitive, even amateurish form such as 3^2, or 4/5. Now there
are web typesetting technologies such as TeX which can be incorporated
into web pages to enable precise display of mathematics, for example:
Deinite integration:
5
∫1 3x
5
4
2
3
+ 2x dx = x5 + x2
2 1
5
2
2 3
3
= 55 + 52 ⫺ 15 + 12
5
2
2 5
= 1900 -1.6 = 1898.4
Multiplication of matrices:
⫺4 0 3 (⫺4 ⫻⫺3) + (0 ⫻⫺4 )
3 ⫺2 4 = (3 ⫻⫺3) + (⫺2 ⫻⫺4)
12 + 0
=
⫺9 + 8
For the technically minded the TeX code -b \pm \sqrt{b^2 – 4ac} \over 2a
would be displayed as the familiar quadratic roots formula.
Adobe Flash offers further interactivity. In fact the full integration of
video, animation, drag and drop and other mouse actions is possible. Some
websites have maximized this potential, MyMaths being a prime example.
MyMaths uses a sophisticated Flash-driven display to take the student
through a topic in stages. At each stage the student is encouraged either to
follow a train of thought on-screen or else to interactive with it to solve
The Uses of Online Resources
151
problems or submit numerical solutions. It might be argued that to some
extent the MyMaths content is designed to replace the teacher.
In the United States the site Explorelearning has for some time been
using Flash and Shockwave to develop interactive material for pupils in
grades 3 to 12, not only for mathematics but science too. Mathematics is
covered up to the level of college algebra and pre-calculus. Explorelearning call these interactive resources ‘gizmos’ and although the site is not
free, many of the 450 gizmos available can be viewed without payment for
a few minutes.
A-Level Mathematics Websites
So, there is a lot out there, and it gets better all the time. But one problem
remains: access. How does the busy teacher or student ind this stuff when
they need it? Many sites on the internet have in the past specialized in providing links to recommended sites, but such lists, which are often extremely
long, are hard to maintain and very hard to ensure continued relevance. As
far as A level mathematics goes, there are three sites in the United Kingdom
that are attempting to provide a coherent approach to managing a large
body of interactive material. They are:
1. MathsNetAlevel
2. Further Mathematics Support Programme (FMSP)
152
Mathematics Education with Digital Technology
3. MyMaths
None of these sites provide their content completely for free, but
require yearly subscription. MyMaths is already well known in schools
for its coverage of GCSE mathematics and has within the last year begun
developing A-Level modules. The other two have been established for
some time.
A dificulty confronting online providers is the various examination speciications available in the United Kingdom. Currently there are those provided by AQA, Edexcel, OCR, OCR-MEI, CCEA and WJEC. Scottish Highers
and Advanced Highers are signiicantly different in style and content to the
rest. Though the speciications are similar they are not identical. OCR-MEI,
for example, offers modules that the others do not; ‘Differential Equations’
and ‘Numerical Methods’ being two of them. Both MathsNetAlevel and the
FMSP cater in detail for these various speciications, while MyMaths is part
of the way there.
FMSP and MyMaths offer a subscription within which the user chooses
which syllabus elements they want to use. MathsNetAlevel requires the
user to choose their syllabus at the outset. Once the user has logged on,
they must select the module they wish to work on and then choose a topic.
From there on a vast array of resources awaits. Here is a selection from the
three sites:
Step by step illustration of algebraic techniques:
Investigation of quadratic graphs
Investigate parabolas
Investigate polar graphs
154
Mathematics Education with Digital Technology
The Users
The above websites all aim to support the student in their studies at home
or at school and are also intended to be used by teachers in the classroom
with the aid of an interactive whiteboard. The resources are multipurpose.
Here are four possibilities.
The Student
The student sitting alone at home can work through carefully structured
sequences of work, where feedback is usually immediate and on-screen. The
student can, to a large extent, teach themselves. This may become increasing important given the problem that schools are inding in funding further
mathematics courses in their establishments – and in some cases AS and A2
courses too. There is consequently a distinct rise in the number of students
following advanced level courses by ‘self-study’. One of the fundamental
jobs of the Further Mathematics Support Programme (FMSP), which came
into existence in August 2009, is to support schools and colleges in a similar
way to the previous Further Maths Network. The aim is to help schools and
colleges that do not currently offer Further Mathematics to start offering it;
provide CPD courses to help schools and colleges to develop their capacity
to teach Further Mathematics; and liaise with NCETM to establish networks
to support teachers of Further Mathematics. ‘Self-study’ is unfortunately still
the only route some students ind to a further mathematics A-level in regions
where the FMSP has not got off the ground.
The Teacher
These interactive tools are also aimed at the teacher. They are usually
designed to work with minimal technical knowledge required on the teacher’s part, and with an interactive whiteboard in mind. Mouse actions such
as drag and drop are heavily utilized. The tools are not in general openended but designed to illustrate or solve a speciic mathematical problem,
with the advantage that the teacher does not spend time learning how to
run the software but can instead concentrate on how to integrate it into his
or her lesson planning. The teacher can build their lesson around these
tools, knowing that the student will then be able to follow up the lesson
themselves in their own time using the same resources. One of the new
features of MathsNetAlevel is the ability to create one’s own randomized
The Uses of Online Resources
155
exam paper. Questions can be freely chosen from a speciic module and
then printed out along with a corresponding mark scheme. The teacher
can issue the paper as a homework task, or else require the students to print
their own, to be followed up by a formal test in class. The randomizing of
the question content means that repetitive practice on the skills needed is
fully realized, and relevance is maintained by regular updates to the site
based on the most recent public examinations.
The Tutor
Besides the student and their teacher, a third potential aim of these activities is the online tutor serving the function of the conventional teacher
only without the face-to-face element. The internet provides forum and
conferencing facilities, even free online whiteboards such as ‘scriblink’ or
‘skrb’, all of which could be combined with on-line phone facilities such as
‘Skype’ to create a fully communicative medium. With these technologies,
the online tutor can talk and write to their students, illustrate the topic
under discussion and point their students towards follow-up work, and they
can use a forum to keep this all organized with dates for meetings and deadlines, and so on.
Conclusion
Professional Development
The ideas summarized for the tutor can be utilized further by groups of
teachers for the purpose of professional development. As mentioned earlier a issue confronting the provision of A Level courses is the number of
students applying but also there is the issue of the ability and suitability of
teachers to teach the course, particularly as speciications change. Using
the tools of forums, conferencing, collaborative online whiteboards, the
likes of Skype and the resources provided by the A-level mathematics websites, groups of teachers can receive professional training in their own
homes.
Teachers can thus develop and improve their mathematics understanding and at the same time become familiar with the kind of online interactions that their students will already be taking for granted!
156
Mathematics Education with Digital Technology
References and Websites
All websites accessed on 5 February 2011.
Autograph www.autograph-math.com/
Explorelearning www.explorelearning.com/
Further Mathematics Support Programme: www.furthermaths.org.uk/index.php
Geogebra www.geogebra.org
Geometer’s Sketchpad www.dynamicgeometry.com/
JavaMath http://math.hws.edu/javamath/
MathsNetAlevel www.mathsnetalevel.com
MyMaths www.mymaths.co.uk
NCETM www.ncetm.org.uk/
Scriblink www.scriblink.com/
Skrbl www.skrbl.com/
Skype www.skype.com/intl/en-gb/
Weompmath http://webcompmath.sourceforge.net/
Chapter 16
What Do the Subject Associations Offer?
Ruth Tanner
Mathematics Consultant, Shropshire, UK
Introduction
Most teachers of mathematics spend some time learning about ways to use
Information and Communications Technology (ICT) to enhance their
teaching during their training. However, their potential to explore and
practise the ideas that they encounter or develop depends, to some extent,
upon the facilities available at their placement schools. Once qualiied and
working in a school it becomes much harder for teachers to continue developing and extending their use of ICT, unless they are fortunate enough to
work alongside colleagues who are skilled users of ICT.
Understandably therefore, many teachers of mathematics use the expensive ICT equipment available to them as an electronic text book or to support their classroom management (e.g., by displaying objectives, notes and
homework tasks using pre-prepared PowerPoint slides or interactive whiteboard lipchart pages). In contrast to this, the document, ‘Secondary mathematics with ICT – A pupil’s entitlement at Key Stages 3 and 4’1 outlines ‘six
major opportunities for learners to beneit from the use of ICT in mathematics’. This inspiring document was produced by Becta in association
with the Mathematical Association (MA)2 and the Association of Teachers
of Mathematics (ATM)3. Learners whose teachers consistently limit their
use of ICT to little more than displaying notes, however colourful, will miss
out on the engaging and stimulating teaching approaches that this document suggests ought to be an entitlement for learners of mathematics in
the twenty irst century. Developing and improving their use of ICT can be
dificult for some teachers. In my own journey to become an ever more
effective and innovative user of ICT the mathematics subject associations,
158
Mathematics Education with Digital Technology
and in particular the MA and ATM, have always played a vital role and they
still continue to do so.
Subject Association Journals, Publications and Software
Teachers who are members of the MA and ATM regularly receive the subject association journals (Mathematics in Schools, Primary Mathematics and
Mathematics Teaching) and since July 2009 members of ATM can also access
the on-line, interactive journal Mti4 (Mathematics Teaching interactive). These
journals offer teachers inspiration, challenge, support and encouragement
as they seek to relect on their teaching and explore new ideas, including
those that involve the use of ICT. Software packages such as graph plotters,
dynamic geometry and computer algebra systems have so much potential
to enhance the teaching of mathematics, but understandably teachers often
ind it hard to know how to introduce these packages into their classrooms.
Reading accounts of the use of these packages in Mathematics Teaching, Primary Mathematics and Mathematics in Schools can be a good way to acquire
ideas and gain the conidence needed to get started. Many articles are now
supported by online resources, especially those that appear in MTi.
An article may teach a new technical skill. For example some teachers will
have been introduced to constructing sliders in Excel for the irst time
when reading the Micromath article Scroll Bars in Excel.5 Articles have the
potential to open up a whole new area of use for a software package that the
reader is already familiar with. For example, I still remember how reading
Adrian Oldknow’s article ‘Mathematics from still and video images’6 introduced me to the idea of pasting photographs into dynamic geometry or
graph plotting software to encourage work on transformations. This then
led me to experiment with pasting local maps instead of photographs into
dynamic geometry software. Thus creating a tool for exploring bearings in
a more meaningful context than ships and lighthouses for learners in the
Midlands! But above all, along side the lesson ideas and technical tips, these
articles nearly always focus on the pedagogy of using ICT and the ways in
which its use can open up new approaches to learning some aspects of
mathematics. The focus moves from the teacher getting the equipment
connected and then running the software correctly to the pedagogy involved
in improving learning.
As it becomes more and more dificult for schools to release teachers to
attend courses during the school day the journals of the subject associations
have the potential to be used to offer an alternative form of professional
What Do the Subject Associations Offer?
159
development. Teachers working individually or in pairs could choose an
article which is relevant to them and experiment with some of the ideas in
their own classrooms. Indeed, working in this way could become part of an
individual teacher’s performance management or a whole department
development plan with appropriate time and resources allocated to it.
In addition to the journals the subject associations sell books and
resources. ATM also sells some software of its own which it claims is designed
‘to encourage discussion, support teaching and challenge students’
thinking’.7 Because of these design aims the products are accompanied by
support materials and lesson ideas to guide less experienced users of ICT.
Teachers who use some of these support materials will usually ind that, as
well as their students being challenged to think, discuss and reason they
themselves are also challenged to think about their pedagogy. Consequently
the teacher becomes more effective at exploiting the potential of ICT in the
classroom.
Subject Association Branches and Conferences
For many teachers their contact with any subject association that they
belong to is solely through the journals and publications. These teachers
are missing out on another important aspect of the work of these bodies
which is the provision of both national and local conferences and the work
of local branches.
Over recent years many subject association branches have included meetings and workshops on aspects of teaching and learning mathematics using
ICT. Branch meetings generally take place two or three times a year, out of
school hours (often on a Saturday morning or a weekday evening) but the
extra commitment required to attend is always well worth it! The ethos of a
branch meeting is very different to that of a commercial course led by a
paid tutor. A branch meeting or a conference brings together teachers with
a variety of experiences from a wide range of educational establishments
and phases (I have seen a newly qualiied teacher working on some mathematics with a retired Ofsted inspector at a branch meeting.). Being able to
see ideas in action and talk to those enthusing about them is even better
than reading about them. It is always good to see equipment or software
being used by a colleague and have the chance to try it out oneself. The
result is usually an added enthusiasm and determination to pursue the
funding required to purchase the new equipment or software. I remember
talking to a teacher who had a data projector but had been waiting for
160
Mathematics Education with Digital Technology
2 years for an interactive whiteboard for her classroom. At a branch meeting she saw a tablet PC, wirelessly connected to a projector, being used as an
alternative. When she got back to her school the network manager told her
that the projector in her room already had the wireless facility and that she
could swap her laptop for a tablet PC. Less than a month after the branch
meeting she had the new equipment up and running and was thrilled.
It is often when software or hardware is used at a workshop that teachers
become inspired to have a go themselves. For me this was my way into getting students to use dynamic geometry. I had taught myself to use some
dynamic geometry software I had purchased but it was only after attending
an ATM workshop where we used dynamic geometry to explore the properties of quadrilaterals that I began to use dynamic geometry with students.
Subject Associations Working with Other Agencies
The Mathematical Association and the Association of Teachers of Mathematics frequently work with each other and with other agencies such as
British Educational Communications and Technology Agency (Becta), the
Department for Children, Schools and Families (DCSF), the National Centre for Excellence in Mathematics Teaching (NCETM)8, and Bowland
Maths9 to produce resources and provide professional development aimed
at empowering teachers to make better and more effective use of ICT.
These partnerships have resulted in some excellent free resources for teachers in the United Kingdom.
Micromath Book and CD
One such collaboration resulted in a free book and CD entitled Integrating
ICT into the Mathematics Classroom10 being given to every maintained secondary school in the United Kingdom. In 2005 Micromath, an ATM journal,
merged with Mathematics Teaching and the book is a celebration of the
21 years of the journal’s contribution to encouraging and developing the
use of ICT in classrooms. The CD is well worth looking at if you can ind it.
Not only does it contain a more extensive archive of articles than the book
but it also contains a wealth of other free resources. The CD contains a gallery of 125 photographs for use with an interactive whiteboard, dynamic
geometry package or graph plotter; a collection of free software; some
excellent tutorials for getting started with Cabri and Geometers Sketchpad
What Do the Subject Associations Offer?
161
and some resources for graphical calculators. Also on the CD are six units
of work using ICT. Although these units were developed prior to the new
National Curriculum they could be used to support the teaching of the Key
Processes set out in the New Curriculum11.
Practical Support Pack
The DCSF website has a section devoted to learning and teaching using ICT
called the Practical Support Pack12. The secondary mathematics section of
the Practical Support Pack offers another collection of units of work which
involve the use of ICT that were developed with the support of the MA.
Teachers’ TV
The subject associations continue to work closely with Teachers’ TV13 which
provides a range of free videos giving practical examples of ICT being used
in mathematics classrooms and of individual teachers and departments
increasing and improving their use of ICT.
Delivering Professional Development
From time to time the subject associations also work with some of these
other agencies to provide ‘hands on’ professional development to help to
build up the conidence of less experienced users of ICT, introducing them
to some practical ideas and giving them the time to try things out in a supportive environment. The evaluations from these events invariably show
that most teachers return to their classrooms feeling more conident and
enthusiastic about trying out some of the ideas they have been working on.
Again these events give delegates a chance to try out not just software but
also equipment that may be new to them and an opportunity to see the use
of ICT as more than just interactive whiteboards.
Conclusion
It is not necessary to know everything about a piece of software in order to
be able to begin to use it effectively and creatively. Most open software is so
powerful that few of us know its full potential, there is always more to learn!
162
Mathematics Education with Digital Technology
The software and hardware that teachers have access to are constantly
developing and improving.
One of ATM’s four Guiding Principles is:
It is important to examine critically approaches to teaching and to explore
new possibilities, whether deriving from research, from technological
developments or from the imaginative and insightful ideas of others.
Through the journals, branches and conferences some members of the
subject associations continue to ‘explore new possibilities’ and to learn
from the ‘insightful ideas of others’ as they strive to use ICT to improve the
experiences of twenty irst century learners of mathematics.
Notes
All websites accessed on 5 February 2011.
1
2
3
4
5
6
7
8
9
10
11
12
13
www.teachernet.gov.uk/teachingandlearning/subjects/ict/bectadocs/sec/
www.m-a.org.uk
www.atm.org.uk
www.atm.org.uk/mti
Mulkerrin, P. (2000) ‘Scroll bars in Excel’. Micromath, 16/2, 24–27.
Oldknow, A. (2000) ‘What’s in it for Mathematics?’ Micromath, 16/2, 30–34.
Association of Teachers of Mathematics, Mathematics Resources Catalogue 2009–
2010, pp. 8–9 www.secondarymathsite.co.uk/Organisations/ATM/ATM1/ATM_
Web_Catalogue%20Final.pdf
National Centre for Excellence in Mathematics Teaching. www.ncetm.org.uk
www.bowlandmaths.org.uk
Edwards, J. and Wright, D., Integrating ICT into the Mathematics Classroom, Derby,
Association of Teachers of Mathematics 2005
http://curriculum.qcda.gov.uk/
www.dcsf.gov.uk/psp/index.aspx
www.teachers.tv
Chapter 17
Modelling, Functions and Estimation:
A Pizza Problem
Chris Olley
King’s College, London, UK
Introduction
As part of the Bowland Trust project to produce teaching materials to support applications of mathematics, King’s College, London, developed a project in which students watched pizzas cool. The temperature of the pizzas is
measured over time using data logging apparatus.
The pizza shop owner has hired mathematical consultants to support
them in maximizing their market and hence their proit. Pizzas need to be
developed fresh and hot. Many issues need to be addressed in this project,
but two key questions emerge: How far can my deliveries reach with the
pizzas remaining suficiently hot? Does it matter how I package them? This
requires two experiments, irst to determine the least acceptable temperature, and secondly, to determine the time taken to reach this temperature
with different packaging. The irst is simple and requires a volunteer prepared to eat small pieces of pizza as it cools. Generally, the volunteer is not
hard to ind! It is the second experiment which throws up a lot of interesting mathematics.
It is important to recognize that there is no pizza shop, nor will our report
actually affect one. Our students are principally motivated by a desire to get
on in their mathematics. Frequently scenarios are presented in class as problems being solved as if they were in the ‘real world’, that is, motivated by the
requirements of the supposed scenario. Paul Dowling (1998) refers to this as
the myth of reference. Clearly, pizza shop owners are unlikely to employ consultants with data logging apparatus and computer algebra systems for advice
on their business plan. However, the scenario brings a welcome sense of fun,
plus the warm smell of pizza to the mathematics classroom. This recognition
164
Mathematics Education with Digital Technology
is important. Details of the mathematical development could be argued as
unnecessary for scenario and the mathematical development would be
restricted. We need to retain our perspective on our real purpose, being to
develop the mathematics. We do nonetheless have a setting which motivates
the desire for quality outside our area of expertise. The two experiments
require some serious scientiic consideration. Indeed, when we have presented this idea to adult teacher professionals, the focus has often been on
critiquing the quality of the experimental set-up. Students in our trial schools
did not. However, it clearly provides an opportunity to collaborate with science departments, who would wish to discuss the experimental design and
improve it. Equally, an initial discussion about maximizing the proit of the
pizza business throws up many issues (e.g., total proitability, cost/beneit of
additional employees, food quality issues, etc.) which are outside the experience of most mathematics teachers. Instead of making an unrealistic attempt
to ‘deal’ with them these could be studied in the business studies department, where this expertise resides.
What do students see when they look at a graph? Activities involving story
graphs are frequently designed to help the student visualize the change in one
variable dependent on another. However, constructing the story is dificult
and the simpliications in the graphical representation often strain credulity –
the strange stories of children walking with constant speed being a case in
point. I have frequently used real time distance logging apparatus with experienced teachers and have been struck by how often they walk towards it when
the distance/time graph they are supposed to be tracking goes up or ask me
where they should start when the graph clearly shows the distance at time zero
(see, Teachers TV, 2006). That there is a complicated link, often weak, between
the scenario and the graph seems clear. Having, the possibility to collect the
data in real time as a clearly known process is unfolding in front of the learners’ eyes (and nose!) provides a powerful link.
Jeremy Rochele has developed SimCalc, a software simulator which produces cartoon images of motion activities (e.g., characters running at different speeds) together with a graph and table of values. This provides an
example of multiple representations (see Ainsworth and VanLabeke, 2004)
which is a key design precept of the TI-nspire software discussed in this
paper. Rochele et al. presents outcomes from control and treatment groups
involved in using the SimCalc to study ‘the mathematics of change and
variation’. They found
Although, on average, Treatment and Control group students progressed
equally well on simple mathematics, the Treatment group gained more
Modelling, Functions and Estimation
165
on complex mathematics. For example, at post test, Treatment students
were more likely to use the correct idea of ‘parallel slope as same speed’,
whereas Control students were more likely to have the misconception
‘intersection as same speed’. (Roschelle et al. 2007)
Test items examined exactly the misconceptions that SimCalc is designed to
address, so it would be interesting to compare the quality of the input
received by the control group. Nonetheless, this seems to have been effective in generating a felt link between motion and graph. In our case the
measured change is happening in reality (rather than virtual reality) which
may perhaps create a stronger link, although this remains to be examined.
It is necessary to be clear about our purpose here. We intend to watch the
change in temperature of a pizza over time, in order to ind out how long it
takes to reach a certain value. (In our experiments we found 48° to be the
least acceptable temperature). Now this could take a long time, longer than
we could reasonably continue measuring for (certainly in an ordinary lesson). So, we will see if we can ind a rule for the rate of cooling that will
enable us to predict how long it will take. The predicting aspect requires
the setting up and critiquing of a mathematical model, yet seems sensible
enough in the context of the scenario. It is routine in classrooms to ask
students to estimate. However, students need to have the opportunity to
develop their skills in estimation and critically relect on the how they estimate the future temperature.
In the classroom we tried two different models. One featured the teacher
controlling the experiment using one microwave oven placed at the front of
the classroom with one probe and computer set-up. The second featured
6 groups of students taking turns to use one of two microwave ovens at either
end of the room, each group having its own probe and computer. The data
logging equipment produces a real time graph which shows how the temperature is decreasing with time. It also shows the temperature on screen.
We produced a worksheet in which students are asked to predict the initial
temperature (actually the point at which the temperature starts decreasing, to take account of the probe heating up). Next to each prediction is a
space to state the basis on which the prediction was made. Initially this will
be due to external factors (guess, how hot ovens get, etc.). As soon as the
pizza comes out of the oven it was placed inside one of the packaging types
and the probe inserted. (Mini deep pan pizzas were used to ensure that the
temperature of the topping was being measured, rather than the base). Students had already made their prediction for the peak temperature (i.e., time
zero), so the data logger was set running. Immediately students are asked to
166
Mathematics Education with Digital Technology
predict the temperature at the end of the 1st minute. The experiment is
timed (we used a volunteer timekeeper to shout out 5-4-3-2-1 at the end of
each minute). At the end of the 1st minute, the actual temperature is logged
on the worksheet and a prediction is made for the end of the 2nd minute.
Now, some students start to look at the rate of cooling as an indicator to support their estimate for the end of the 2nd minute. Also, students are asked
to estimate the temperature at the end of the 5th minute. The experiment
continues in this way for 10 minutes, each time students make future estimates. After 5 minutes they estimate for end of the 6th minute and the end
of the 10th minute. By now, students are taking close account of the rate of
change and using this to make better and better estimates for each successive minute. There is an aura of quiet competitiveness and satisfaction when
estimates are close or even perfect. (Reading are taken to one decimal
place). After 10 minutes, they estimate for 30 minutes, 120 minutes and
24 hours. Again the requirement to explain the basis for the estimation is
emphasized. This last part requires students to share their mechanisms for
estimation and discuss how they expect the temperature to change after the
experiment has ended, that is, into the never-to-be-known. It was gratifying
that students happily watched a pizza warming in a microwave oven for
2 minutes then watched it cooling for 10 with rapt attention!
Modelling, Functions and Estimation
167
At the end of the experiment it is clear that the pizza is nowhere near
down to the 48° minimum, so we need some way to work out when it will
reach that temperature. The stage is now set for the key conversation: on
what basis were the estimates made. Typically the cooling graph looks very
linear. When asked how they estimated most considered answers were
along the lines of ‘it was going down about 2.3° a minute’ or sometimes
‘for the irst ive minutes, it was going down about 2.4° a minute and then
for the next ive minutes, about 2.1° a minute’, Both clear statements of
linearity. Depending on the available equipment, the students either drew
a graph by hand from the data on the worksheet, or had access to a dynamic
graph within the data collection software. By tradition, a line of best it
seems an obvious thing to make, so the possibility of setting up a model
comes out naturally. Starting with the simpler suggestion of ‘going down
0.8° a minute’ we can ask, so what was the starting temperature? The software allows us to enter a function, to it the data. So we start at the peak
temperature (in the example it is 84°). So starting with f1(x) = 84 makes
sense. Then it went down by 2.3° per minute so we make it f1(x) = 84 – 2.3x.
The set up makes this look very natural. But then when we hit return to
draw our best it line something is clearly wrong. It requires very little
prompting to see that the 2.3° was per minute, but the data was gathered
168
Mathematics Education with Digital Technology
per second. So we can edit the function to show f1(x) = 84 ⫺ (2.3/60)x.
Happily the software gives an immediate response, so testing different theories for accommodating the minutes to second conversion can be done
quickly by test and check. This feature keeps the discussion on track and
avoids being sidelined by tricky numeracy issues. These can be returned to
later. Often the very beginning of the experiment has an uneven cooling
rate, so a little ‘tweaking’ of the model needs doing. Having seen the construction of the model, students feel in control of the coeficients. They
can move it up or down a bit by changing the ‘starts at’ value and change
the steepness by varying the ‘per minute’ value. They are very impressed by
their capacity to make a near perfect it. Looking at the graph of our best
it function, we can see roughly when the temperature will be down at 48°,
though this may require extending the axes. However, the estimating
power of the function becomes clear immediately. Students who hand
drew their graphs immediately see the lexibility of the software. Fitting a
graph by eye is very useful as it reinforces the power of the function. Clearly
this function its our data very well and so we can use it to ind when the
value of this function is 48. That is 84 – (2.3/60)x = 48. Immediately students recognize that this is an equation. Their knowledge of how to solve
it can now be brought to bear. Powerfully the software includes a computer
algebra system (CAS). Here we can state the equation. Then work on it in
Modelling, Functions and Estimation
169
whichever way students suggest. Sensible and not so sensible suggestions
can be tested and their outcomes considered. That there are many routes
to solution is very empowering here. In the CAS we simply type the equation and enter it. Then take simply state what we wish to do to both sides.
(CAS rightly cannot accept a fraction of 2.3/60 and so writes it correctly as
23/600, generating another key intervention). In the example, we took
away 48, then took away 36, then multiplied by 600, then divided by ⫺23
(a route suggested by a student). The CAS shows the result of an operation
applied to the whole equation. This is quite a striking notion and has subtle advantages over the ‘both sides’ argument. That we have taken away 48
from the whole equation is more resonant with ideas of equivalence
between statements. This does give us the potential for an interesting discussion later. This is about 15 and ½ minutes. For more complicated
functions we may not (yet) have the tools to ind a solution, so it is useful
to demonstrate the solve function in CAS. We simply deine a function
f(x):= 84⫺(2.3/60)x. (Note that we use the symbol “:=” to mean “is deined
as”. The different uses of the equals sign are frequently glossed over in
classrooms and remain a key source of algebraic confusion for students.).
Here we are forced to recognize the difference between the function definition and the equation which we solved). It is good at this stage to test
a few values like f(0) and f(60) to reinforce students’ conidence in the
170
Mathematics Education with Digital Technology
function. We can now use the CAS command solve(f(x) = 48,x) and ind
the same answer as we found using the traditional method. This technique
will become very powerful as modelling with more sophisticated functions
is found to be necessary.
There is considerable debate on the merits of computer algebra systems
with keen advocates promoting their use against a concern for the clear
requirement to effect substantial change in assessment systems predicated
on routine solutions which CAS can perform for the user. (e.g., Bohm et al.,
2004) In this context the CAS is being used to support and sustain the
mathematical narrative. Discussing possible curriculum change in Australia,
Driver suggests that CAS
can be used to “do the messy algebra”. By allowing a student to focus on
the selection of a problem solving strategy or appropriate procedure
rather than the application of the strategy or procedure, and student can
develop their higher-order thinking skills. (Driver, 2008)
This is our purpose here. Beyond the linear case, the graphical transposition and equation solving would be dificult and would certainly get in the
way of the narrative low. Even the linear case requires effective routine
facility, which if not secure will change the focus of the narrative. It does
nonetheless engage the student with the need for this facility and more
clearly motivate its development at a later point.
Returning to the narrative, we now have function which its our data, so
we can test its predictive capabilities. At the end of the experiment, students estimated the temperature after longer periods. In discussion, the
basis on which these estimates were made changed from the short term
mechanism of the linear decrease. After 30 minutes and certainly after 120
minutes most students are suspecting that the rate of decrease will have
slowed. Some students suspect that after 24 hours the pizza will only have
reached room temperature. So, we can test these in the function. Student’s
commit their expectation of the outcome to paper, irst. Neatly, the CAS
can deal with an input like f(24*60*60) to test the 24-hour igure. The outcomes for 30 minutes, 120 minutes and 24 hours respectively, provide an
increasing surprise and realization that something is wrong. Going back to
the graph and extending the horizontal axis progressively provides a visual
conirmation. Students are able to interpret the graph now that they have
identiied the relationship between the downward graph and the cooling
pizza. They are, of course, very well aware that, left to their own devices
overnight, pizzas do not continue cooling, freezing and ultimately going
Modelling, Functions and Estimation
171
below absolute zero! So, they are well oriented to inding a function that
its the data, but does not continue to decrease in this way.
Lesh et al. developed modelling activities for a range of groups from
middle school students to graduate students, they found that,
Few students who worked on this version went through more than half of
a modelling cycle; and, almost none persevered to the point where they
could make even an educated guess regarding predicted gains. After
producing ‘irst-draft answers’, these students did not feel any need to
produce second- or third-draft answers. (Lesh et al., 2008)
They went on to develop their activities, but explicitly to present a second
activity requiring a different analysis. The pizza scenario has the advantage
that the irst (linear) model is overwhelmingly favourite (with student and
teacher participants) and the critique of this model is clearly grounded in
participants existing knowledge of the scenario. However, the insight gained
by relecting on the basis for the estimates sets up the natural concern that
the linear model isn’t quite right. Hence, the second (and third) iteration
appears as necessary development.
Hence, students are now free to explore different functions. The key feature they have seen is the ability to control the shape and position of the
graph by varying the coeficients in the function.
TI-nspire has a useful facility to aid this exploration. When a base function such as f(x) = x2 is drawn, its graph can then be dragged to different
positions and then lexed to change its shape. The software shows the function in its completed square form, which show clearly how the graph has
been transposed. An added bonus here is developing the recognition that
different forms of an equation are powerful in different ways, the completed square form is often only seen as a long-winded way of solving a
quadratic equation.The quadratic function f(x) = x2 is the next most common function for students to meet after linear ones. Students are often
aware of its existence and may have met the shape of its graph. Once in
control of the coeficients, students ind a quadratic which accurately its
the data. They can then use CAS tools from before to solve the equation
f(x) = 48 and test the accuracy over the longer term. It becomes clear with
this analysis that the function falls down in the longer term because it seems
to suggest that pizzas will cool to a minimum and then start heating up
again, becoming very hot indeed by the following day. Once again this does
not accord with the students’ common sense notion of how pizzas actually
behave. Now, they have a very strongly formed mental image of the shape
172
Mathematics Education with Digital Technology
of the graph of the function they are looking for. In our lessons we restricted
exploration to a palette of possibilities consisting of linear, quadratic, reciprocal and exponential function. However, the software can cope with other
interesting functions, which we have tried out in teacher sessions, notably,
piecewise linear functions. These naturally accord with the descriptions of
the variation students suggested that is, a certain rate of decrease over a
certain range, followed by a different rate of decrease over the next part of
the range. With a inal linear function of f(x) = room temperature after a
certain period, this can be an excellent model. Clearly, a well constructed
exponential will also provide an excellent model.
Conclusion
By this stage it is clear that we have far exceeded our requirement to ind
the time for the pizza to cool to 48°. Moreover we have developed our skills
in inding and evaluating models for the cooling function. There is now a
high degree of conidence that we can ind the cooling time effectively in
different situations. The experiment can now be repeated with different
types of packaging. The consultants are ready to report to the pizza shop
owner. With the added calculation of the distance possible given a known
Modelling, Functions and Estimation
173
average speed of the delivery vehicle, the problem becomes one which
geographers and business studies specialists may be better able to relate to.
I have provided a detailed description of a classroom narrative. The structuring of the narrative is built around a mathematical modelling activity,
which is itself couched in a realistic but ictitious scenario. The structure is
carefully designed to continually provide the rationale for further development of the theory. There are two principle mathematical outcomes: (1) an
engagement with the process of mathematical modelling per se and (2)
functions and their graphs.
References
Ainsworth, S. and VanLabeke, N. (2004). ‘Multiple forms of dynamic representation’. Learning and Instruction 14 (3) (June), 241–55.
Bohm, J., Bőjm, J., Forbes, I., Herweyers, G., Hugelshofer, R., Schomaker, G. (2004).
The Case for CAS www.t3ww.org/cas/index.html (accessed on 6 February 2011).
Dowling, P. (1998). The Sociology of Mathematics Education – Mathematical Myths/Pedagogic Texts. London: Falmer Press.
Driver, D. (2008). ‘Pedagogical Use of a CAS’. In ‘Enhancing Understanding and Constructing Knowledge in Mathematics with Technology’. Proceedings of ATCM, 2008.
http://atcm.mathandtech.org/EP2008/papers_full/2412008_15273.pdf
(accessed on 6 February 2011)
Lesh, R., Middleton, J., Caylor, E., Gupta, S. (2008). ‘A science need: Designing
tasks to engage students in modeling complex data’. Educational Studies in Mathematics 68 (2) (13 June), 113–30.
Roschelle, J., Tatar, D. , Shechtman, N., Hegedus, S., Hopkins, B., Knudsen, J.,
Stroter, A. (2007). Can a Technology-enhanced Curriculum Improve Student Learning
of Important Mathematics? (SimCalc Technical Report 1). Menlo Park, CA: SRI
International. http://ctl.sri.com/publications/displayPublication.jsp?ID=623
(accessed on 6 February 2011).
Teachers’ TV (2006) see: www.teachers.tv/videos/ks3-ks4-maths-new-maths-technologyin-the-classroom (accessed on 6 February 2011).
Part Six
ICT Supporting Cross-curricular
Work with Mathematics
In this section we look at some classroom (and outdoor) examples of how
Information and Communications Technology (ICT) can act as a catalyst for
cross-curricular work involving mathematics. The examples are selective and
there are also plenty of opportunities for using for example, data-handling
software for enquiries in geography and history, geometry software for exploring linkages in design technology, and so on. While cross-curricular themed
project work is relatively commonplace in primary schools it is much rare in
secondary schools. However the advent of the new national curriculum in
England coupled with the STEM strategy for schools is providing schools with
increased opportunities to develop enhancement and enrichment opportunities within subjects, and time for regular periods of ‘off curriculum’ time
when cross-curricular activities can take place. In Part 4 we saw some examples
of how new digital technologies can, if used in an appropriate way, help bring
together the technologies usually associated with: (1) students’ own private
pursuits, (2) the way technologists, scientists, mathematicians, and so on,
solve real problems and (3) the content and approaches of the school mathematics, and related curriculum areas. The contributions to this chapter
show a number of innovative approaches now being used in this synthesis of
use of ICT.
Chapter 18
Using Video Analysis to Develop
Modelling Skills in Physics
Steve Hearn
Charterhouse School, Godalming, Surrey, UK
Introduction
In this chapter I present three techniques I use with my students to develop
their modelling skills in physics lessons each using video capture as the
main means of collecting data.
Maths on Video
Imagine a powerful modelling tool. This tool can solve equations that are
an attempt to describe the behaviour of the world, a model. Not only that,
this tool can allow variables in the model to control the behaviour of objects
on the screen. Particles and vectors, balls and arrows, become animated
and move, showing the student what the mathematics is saying so elegantly.
In addition video, photos and data captured from sensors can be examined
on the screen using these animated objects. The effectiveness of the model
at describing nature can be evaluated. Such a tool exists, Modellus.
Modellus (a popular modelling environment fore physics) facilitates the
animation of mathematical models. This might involve just plotting variables. But most powerfully the teacher and student can make the output
from model control the behaviour of objects on a screen. These objects in
turn can be an attempt to represent the behaviour of the real world as indicated by a video running in the animation window.
The screen shot in Fig. 18.1 shows the mathematical model for undamped
simple harmonic motion (SHM) as a differential equation as well as
parameter choices and initial values. These are chosen to match the experimental conditions.
178
Mathematics Education with Digital Technology
Figure 18.1
Screen Shot of Modellus Used to Model an Oscillation
Figure 18.2
Screen Shot of Modellus Used to Animate a Model
Figures 18.2, 18.3 and 18.4 show three further screen shots taken as the
model plays in time. The equations can be seen in the model window. A
mass on a spring system is being modelled. Two copies of this video have
been linked to the animated objects, a vector and a particle. The vector and
particle can be seen superimposed on one copy of the video.
Using Video Analysis in Physics
Figure 18.3
The Animation at a Time When the Displacement is Zero
Figure 18.4
The Animation at the Lowest Point of the Mass
179
In the animation window a point is tracking the motion of the mass and an
arrow represents the instantaneous acceleration of that mass. The spring constant is denoted by k and the mass by m.
The students made a 25-frame per second video of the experiment using
a standard webcam.
In Figure 18.2 the mass is reaching its maximum height. The graph of its
displacement versus time, as generated by the model, is plotted. The students can watch the plot, the video and the acceleration vector simultaneously as they change on the screen.
As the mass approaches the equilibrium position (Figure 18.3) they see
the acceleration vector disappear. This should prompt them to pose some
questions and seek some explanations.
As the mass reaches it maximum displacement below equilibrium they
observe the vector change direction.
180
Mathematics Education with Digital Technology
Of course other plots can be made and additional vectors added to the
animation. (It is important as an aid to understanding not to clutter up the
screen with arrows and plots.)
By running this model, making alterations to the output presentation
and examining the video and graphical output together, students can effectively study the mathematics of SHM.
In some cases students may have written the model, captured the video
and measured k so as to test their mathematical representation of this
motion. This is a powerful teaching experience, if a little demanding, for
most sixth form pupils i.e. those aged 16–19.
For many students the video gives them a feel for the important aspects
of the motion being described by the model and having the video there
while they study technical output allows their understanding of the motion
to develop and deepen.
Such a model can be used to examine students’ understanding by supplying questions to be answered as they run the animation.
Figure 18.5 Showing Video Data for an Experiment with Data Logged with a
Motion Sensor
Using Video Analysis in Physics
181
Synchronizing Video with Data Loggers
Most schools make use of some data loggers in science teaching. Some
use webcams with video pointing software. Few have explored the powerful combination available when video capture and data logging are
combined.
I will describe a simple example to illustrate the technique and highlight
the role it plays in the modelling process. In this experiment from mechanics, a trolley is released to roll smoothly down an inclined ramp pulled by a
string from a mass falling vertically.
A motion sensor has captured velocity time data of the cart being pulled
by the falling mass on a string. A video was made of the experiment and
synchronized to the data. This is a simple process carried out within the
data logging software, Figure 18.5.
When the video runs we see the graph of the synchronized data displayed
simultaneously on the screen, Figure 18.6. Each video frame relates to a
data point.
Figure 18.6 The Video Data Shown with the Graphical Display of the Logged Data
182
Figure 18.7
Mathematics Education with Digital Technology
The Video is Stopped Just at a Critical Point in the Experiment
Here we stop the video at a crucial point in the ilm. The string is just
about to go slack, Figure 18.7.
The string has gone slack as the mass has hit the loor, Figure 18.8. The
velocity time graph has changed drastically.
The velocity time graph has all the physical features of the video encoded.
I challenge the students to draw free body diagrams for various stages of the
video and then relate them to the graphical representation.
To do this successfully the students need to turn the easily digestible video
into a cartoon of free body diagrams where friction suddenly appears to be
signiicant and tension comes and goes. The more I experiment with this
technique in my own lessons the more clearly I see its potential as a tool to
enhance students’ understanding of the processes involved and the way it is
represented mathematically.
Video Pointing
Open Source video pointing software for Physics has been developed in the
USA. I use Tracker which is available from: www.cabrillo.edu/~dbrown/
Figure 18.8
The Video Stopped When the String is Slack
Figure 18.9
A Still from a Video Clip of the Motion of an Air Bubble
184
Mathematics Education with Digital Technology
tracker/. Used with a digital camera or webcam you have a powerful motion
analysis and modelling tool.
Figures 18.9 shows a screen shot of a frame taken from a video clip of the
motion of an air bubble. The software, which keeps track of the pixels you
point to as they move, is being used to explore the question, ‘Is the bubble
at terminal velocity?’
Conclusion
The data produced are good enough to allow us to study models of drag
which attempt to account for the relationship between terminal velocity
and size. The video technique allows good data for the size and velocity to
be captured for a full analysis of drag models. Comparing this technique
with the more common approach using just using a ruler and stop watch
shows the students just how powerful video analysis can be. Of course this
something they already know from watching sports.
The advent of reasonably cheap high quality digital cameras with the ability to record short video clips at very high speeds (up to 1000 frames per
second), such as the Casio Exilim range, opens up whole new areas are
opening up for video pointing analysis.
Chapter 19
Bloodhound SSC: A Vehicle for STEM
Ian Galloway
Science Learning Centre SE, University of Southampton, UK
Introduction
The very title Bloodhound invites the question, why such a name and what
does SSC mean? Bloodhound was launched in October 2008 at the Science
Museum by science minister, Lord Drayson. The project is to build a supersonic car (SSC) which can be driven to speeds in excess of 1000 mph (miles
per hour). Designed by Ron Ayers who was involved with the Bloodhound
missile, it is headed by Richard Noble and has aspirations to have a mini
Apollo Effect. President Obama (2009) in his address to the National Academy of Sciences makes reference to the power of the Apollo Effect.
The average age in NASA’s mission control during the Apollo 17 mission
was just 26. I know that young people today are ready to tackle the grand
challenges of this century
The primary aim of the project is to help stimulate young people to consider STEM (science, technology engineering and mathematics) subjects in
their career plans.
At the time of writing, more than 1000 schools have declared their
interest through registering on the website and downloading materials.
The principal cross curricular teaching tool is the design (technology),
construction (engineering) launch (science) and evaluation (mathematics) of a mini Bloodhound car. A CPD (continuing professional development) programme has been run through the Science Learning Centre
network in which teachers can learn how to use model rocket engines
safely. A number of schools are using this idea to hold collapsed days at
the end of the school year. There is no doubt that launching a rocket
186
Mathematics Education with Digital Technology
propelled car which can reach speeds of 100 mph generates considerable
excitement. What we do not know at this stage is whether or not the
excitement will be suficient to sustain an interest in STEM beyond
school.
It is important to keep in mind the real engineering project which is
supporting the educational programme. Two universities, Swansea and
the West of England are providing the engineering teams to build and
test the car. The design of the car is an amazing mathematical feat in
itself, requiring 18 months of CFD (computational luid dynamics) to
produce a shape which will ‘defeat’ the enormous air resistance at supersonic speeds. The rocket is being specially designed and built for the car.
The jet engine is from a Eurojet ighter plane and presents considerable
unforeseen technological challenge as the electronics do not like being
at ground level! The wheels will be made from solid titanium, but nobody
has ever cast such a large titanium disc before. Safety is of paramount
importance as this project is being followed by schoolchildren. The driver
has to sit just beneath air-intake of the jet engine, so no ejection seat!
Timing of the various operations will be critical to ensure that Bloodhound SSC reaches top speed over the measured mile in the very middle
of the run. This is important as the car must make a return run over the
same track within 1 hour of starting and must therefore be in the right
place at the end of the irst leg as the measured mile remains in the same
location!
Four resources with an evident Information and Communications Technology (ICT) and mathematics link will be outlined here: the use of Google
Earth, measuring the speed of sound, data logging and the slow motion
tool in Windows Media Player. Mathematics will be found in all the resources
but these four will exemplify the cross curricular nature of the project.
Bloodhound SSC - A Vehicle for STEM
187
The Hunt for the Desert
(Geography, ICT and Mathematics)
With the given technology the car will need about 5 miles (8 km) to reach
1000 mph and 5 miles to slow down. With a mile at each for safety the team
will therefore need a lat desert of the right hardness some 12 miles long.
The considerable task of locating suitable areas was undertaken by the Geography Department of Swansea University who used algorithms and Google
Earth to hunt systematically all over the globe for candidate deserts.
The exercise in the education resources makes use of the Google ruler on
the tool bar to measure distances at any scale. Students have to locate Black
Rock, Nevada (scene of earlier land speed record runs) and determine
whether or not the site is long enough for Bloodhound. The primary school
version gives the coordinates of Black Rock as it is not so easy to locate the
target. The task reinforces the use of coordinates and additionally the altitude is given so that scales at different heights can be calculated. Does doubling the height halve the scale?
The Speed of Sound
(Mathematics, ICT and Science)
Being a supersonic car makes determination of the speed of sound important for determination of the Mach number (ratio of the vehicle speed to
the speed of sound at that location). The speed of sound depends mainly
on the air temperature and its determination is relatively easy using free
software such as Audacity.
Downloading Audacity is straightforward. Old earphones which can be
pulled about a metre apart are used as microphones and plugged into
the microphone socket on the laptop or PC. By separating the earphones
and clapping your hands near one of them at a point co-linear with the
two phones the time difference for the pulse to travel from one phone to
the other can be measured. The screen shot in Figure 19.1 shows the
time difference from the peak of the irst wave in the pulse to the peak of
the same irst wave as it arrives at the second phone. Times are in microseconds and this requires the student to handle small numbers when
working out the speed. The time is returned in a small window at the bottom of the screen but can be checked using the scale at the top. The
process is good enough to show different speeds at different temperatures
and a model relating sound speed to temperature can be constructed.
188
Mathematics Education with Digital Technology
Figure 19.1
Typical Result for Speed of Sound Measurement Using Audacity
Impulse and Momentum, Data Logging
(Mathematics, ICT, Technology and Science)
Having built a car, students could test the engine to predict the maximum
speed. This can be done in the classroom but teachers may prefer to go
outside for safety! The iring of the engine could be a science task and students could take their data to maths class to make their predictions but in
any case the exercise is a mathematical one wherever the analysis is carried
out! The previous experiment to measure the speed of sound can also be
described as data logging but this one uses commercial apparatus which all
science departments will have. A force sensor is set up with the car’s nose
against it. When logging is commenced the rocket engine is ired and the
thrust data collected, Figure 19.2.
In the example in Figure 19.3 the area between the graph and the time axis
has been highlighted and the software returns the impulse in Ns (Newton
seconds). Since impulse equals change in momentum the maximum speed
can be calculated if the car’s mass is known. The acceleration can also be
calculated so that the length of the track needed to reach top speed can be
estimated. The second blip on the graph is the parachute charge being
ejected from the engine.
This exercise reinforces use of equations and develops graphical interpretation as well as being a technological process yielding scientiic data.
189
Bloodhound SSC - A Vehicle for STEM
Figure 19.2
Force (N)
0.6
0.0
0
–1.0
Test Launch in a Classroom, Smoke Detectors Off!
2250
4500
6750
–2.0
–3.0
–4.0
–5.0
–6.0
–7.0
–8.0
–9.0
–10.0
–11.1
09 June 2009 13:54:13
Figure 19.3
Time (ms)
Typical Results, Force Against Time
(note the inversion due to the sensor being pushed rather than pulled)
The Bloodhound engineers have had to go through the same process for
the real car.
The Motion (Mathematics, ICT,
Technology and Science)
Reading the graph to understand what is happening during the motion is
in itself a challenging exercise.
9000
190
Mathematics Education with Digital Technology
500
30
450
Velocity (metres/sec)
350
10
300
250
0
200
150
-10
100
50
-20
0
0
20
40
60
80
–50
100
120
-30
Time from start (seconds)
metres/sec
m./sec/sec.
Figure 19.4
Proile of the Motion of Bloodhound SSC
The two graphs shown in Figure 19.4 are the velocity (smooth) and acceleration curves. There is a great deal that students can identify with the
events taking place during the run such as the opening of parachutes and
ignition of the rocket. The real cross-curricular approach comes when students launch their model car and attempt through various means to analyse
the motion and compare it to their predictions.
Figure 19.5 shows how the car was ilmed and played back with Windows
Media Player. Chalk marks have been made on the ground and the play
speed settings selected (right click in the control bar, then select view,
enhancements and play speed settings). This allows the video to be advanced a
frame at a time and providing the frame speed is known the (average)
speed can be measured at different points along the track.
Some schools have organized competitions around the real engineering
challenge. It turns out that using a C sized model rocket engine will require a
50 m track, and even then a substantial amount of bubble wrap will be needed
at the end of the track for the car to be brought to a halt! The real track will
be about 10 miles so the measured mile is about a tenth of the whole distance.
In the model world a 5 m section of track will therefore correspond to the
measured mile. The challenge is to place the beginning and end markers of
the 5 m section and ilm over that part to measure the speed reached.
Acceleration (metres/sec/sec)
20
400
Bloodhound SSC - A Vehicle for STEM
Figure 19.5
191
A Still from a Film with Chalk Marks
Conclusion
There are other resources on the Bloodhound website which attempt to
integrate the STEM subjects. The view taken within the Bloodhound team
is that engineering is a STEM profession. Any engineering project is a combination of mathematics, science and technology and represents a real
STEM activity, Bloodhound SSC being no exception. There are links to
earth science, history and geography so that a true sense of a real world task
needing the application of a large range of skills emerges. There is no
escape from the all pervading presence of mathematics and the idea that
progress can only be made with its application. The mathematical
applications need not be complex but they are ubiquitous even where not
explicit. Time will tell whether or not the desired Apollo effect is achieved
but the early part of the story shows that children are excited by this real
world engineering project to re-take the World Land Speed Record.
References
All websites accessed on 6 February 2011.
Audacity, http://audacity.sourceforge.net/
Bloodhound, www.bloodhoundssc.com
Google Earth, http://earth.google.co.uk/
Obama, B., (2009). www.washington.edu/externalaffairs/fedrelations/presidentobama-makes-remarks-to-national-academy-of-sciences/
Chapter 20
Modelling Action in Sports and Leisure
Matt Pauling
National Development Manager, Youth Sport Trust
Adrian Oldknow
Emeritus Professor, University of Chichester, UK
Introduction
Hampshire LA ran a 2-year pilot project in 2006–2008 with 5 secondary schools
each identifying a maths, science and D&T teacher to work with other colleagues using Information and Communications Technology (ICT) to stimulate cross-curricular work. The project, directed by Ron Taylor, was supported
by the Microsoft/TDA `Partners in Learning’ initiative. Henry Cort School is
a Sports College which developed ICT based approaches for links with maths,
science and D&T in sport. These have been carried forward into more specifically STEM based R&D and CPD activities in the region. Some of the Henry
Cort work is featured on Teachers’ TV: www.teachers.tv/videos/quadraticequations. It was a case study for the Youth Sports Trust’s ‘Raising Your Game’:
www.ncetm.org.uk/iles/360544/Raising+Your+Game+coresubj_070307.pdf.
Types of Activity
The main activities involved throwing, kicking, hitting, jumping, iring, and
so on. Technically these are forms of projectile motion, which was the basis
of the study of dynamics (forces, acceleration, velocity etc.) which led to the
discoveries and theories of Galileo and Newton. A simple example is throwing a small hard ball at an angle. In order to ind data about its motion we
have three main techniques, each of which involves ICT:
z
Measurement and modelling
Modelling Action in Sports and Leisure
z
z
193
Data capture from sensors
Data capture from video clips.
Measurement and Modelling
Measurements can be made by estimating, or with simple techniques like
counting and pacing, or using instruments like protractors, tape measures
and stop watches. For many sporting events, such as sprinting or track
cycling, these are not accurate enough and computer based measuring systems are used. Some games require judgment for example, to decide
whether or a ball, or batsman, was in or out. The human line judge, referee
and umpire is increasingly being supported by ICT based systems, such as
tennis’s Hawkeye system.
For a projectile we can measure the launch angle A°, horizontal range
R m. and light time F s. Assuming ideal conditions, such as no air resistance,
spin or wind, and that the launch was from ground level, then the science
theory states that the only force acting on the object after launch is that of
gravitational attraction – so the acceleration downwards is g ms-2 and horizontally is 0 ms-2. From these, together with the ideas of speed as distance
divided by time, and acceleration as change in speed divided by time, we can
derive formulae for the motion such as H = R/F, V = H tan A, g = –2V/F and
also ind the position (x,y) at time t as x = Ht, y = Vt – ½ gt2 . This use of algebra to ind features of the motion based on scientiic principles is called
mathematical modelling. The algebraic formulae can be embedded in a
spreadsheet and so be used to create a simulation of the ball’s light. Using
mathematical software such Geometer’s Sketchpad, Cabri II Plus, TI-Nspire, Autograph – or graphical calculators and TI-Nspire hand-helds – graphs can be
made directly from the measurements and calculations as shown in Figures
20.1 and 20.2. These models can be used to predict behaviour for different launch angles, projection speeds, and so on. The predictions can be
tested practically to see how well the model matches with reality. Note that
this gives an experiment from which gravitational acceleration g can be
measured.
Data Capture from Sensors
A common system used in science for timing events involves light gates connected to data-capture software on a computer. Knowing the positions of
194
Mathematics Education with Digital Technology
Figure 20.1
An Excel Spreadsheet Projectile Model
Figure 20.2
A TI-Nspire Projectile Model
Modelling Action in Sports and Leisure
195
the gates, and inding when an object passes through each, we can compute
its average velocity. A range-inder, or motion detector, can measure distances to a given object in motion and be used to plot its distance-time
graph, while also computing numerical approximations for velocity and
acceleration. Such a sensor (CBR2) is shown in mathematics lessons on
Teachers TV programmes
z
z
KS3/4 New Maths Technology: www.teachers.tv/video/154
Resource review: secondary maths 2: www.teachers.tv/video/4872.
Video clips of its use, and a lesson plan, can be downloaded from the
NCETM website – on which you will need to register irst: www.ncetm.org.
uk/Default.aspx?page=14&module=com&mode=102&comcid=241&comf
=40093&comu=0 .
A more sophisticated approach uses one or more accelerometers attached
to the object in motion – in this case probably a human runner, jumper,
cyclist, and so on. Speed data can also be captured with a radar or laser
speed gun. Once a data set has been captured it can easily be transferred
into a spreadsheet, or software for data analysis such as Fathom or TI-Nspire.
TI-Nspire hand-helds and software support direct data capture from probes
such as the CBR2 and low-g accelerometer. Another approach uses a wireless system, such as Vernier’s Wireless Dynamic Sensor System, together
with a Bluetooth receiver and laptop PC: www.inds.co.uk/education/
edusyswdss.htm. Using this system strapped to an object, data can be captured and displayed in real-time. Another exciting development supported
by Vernier’s LoggerPro 3 software is to synchronize graphs of captured data
with video clips of the experiment. So, for example, we can compare the
acceleration of a sprinter leaving the starting blocks with video of the action.
Figure 20.3 shows a video of spring-mass system together with force and
acceleration graphs.
Another development is the data capturing element of the Sciencescope
rocket: www.sciencescope.co.uk/rocketlogger.htm. This consists of a thin
plastic tube containing three accelerometers, a pressure gauge, a timer and
a battery. It can be charged up from a USB port, detached, attached as the
payload for a rocket, launched from an Airburst rocket kit, recovered,
reconnected and the data downloaded. The output can be data in a spreadsheet format (CSV) and/or a simulated video clip in Google Earth (KMZ).
The data logging unit can also be strapped to an athlete or to a suitable
piece of equipment, such as a javelin, although Google Earth output will
not always be possible. Another possibility is opening up based on GPS
technology: www.vernier.com/probes/vgps.html. Many of these approaches
196
Figure 20.3
Mathematics Education with Digital Technology
Vernier’s Logger Pro 3 and WDSS
are suitable for prototyping within practical work for D&T, ICT or Electronic
Systems – or by skilled teachers and technicians. We are now investigating
prototyping systems such as the Italian Arduino control boards and sensors:
www.arduino.cc/en/.
Data Capture from Video Clips
Video analysis systems for use in sports have become relatively established
in schools through systems such as Dartish, Quintic, Swinger and Kandle. The
use of Dartish with video capture of a badminton service in Arnewood College is another DfES video case study: www.ncetm.org.uk/Default.aspx?pag
e=14&module=com&mode=102&comcid=241&comf=40084&comu=0
Here digital video from a camcorder is downloaded to Dartish, where
positions of the shuttlecock are annotated on successive frames. The resulting screen image is captured to the clipboard and pasted as the background
in Geometer’s Sketchpad over which graphs are drawn and manipulated to give
good mathematical models. The analysis is done in mathematics lessons,
while the theory and explanations are done in science. Figure 20.4 shows a
similar image captured from a free throw at basket-ball. The known height
of the basket enables calibration and a variety of quadratic models can
quickly be tried out. This technique of bringing the outside world into the
Modelling Action in Sports and Leisure
Figure 20.4
197
Mathematical modelling with Sketchpad
©TDA 2008. Reproduced with permission from the Training and Development Agency for Schools
mathematics classroom was used in a recruitment poster by the TDA in
2008 – see Figure 20.5.
The good news is that video data capture can be achieved using relatively
cheap devices such as the video mode on digital cameras and/or phones or
cheap video devices like Disgo and Flip cameras. There are low cost science
packages such as Vernier’s Logger Pro 3, which support video data capture,
but there is also open-source free US software. Henry Cort originally used
the Vidshell package developed by Doyle V. Davis, which you can download
together with a library of video clips from: http://webphysics.ccsnh.edu/
vidshell/vidshell.html. This is used with a screen shot to capture an annotated image of the position of a basketball as the background for analysis in
Sketchpad.
As part of a QCA project ‘Engaging mathematics for all learners’, Teachers TV has ilmed pupils from Wildern school undertaking a playground
project in which they also use video analysis: www.teachers.tv/video/37909.
They use Tracker, a free Java applet from Doug Brown: www.cabrillo.
edu/~dbrown/tracker/. With Tracker you import a video clip, calibrate it,
overlay axes and record data while tracking the position of an object. While
198
Figure 20.5
Mathematics Education with Digital Technology
TDA Poster 2008
the video is being annotated in one window, a table of data is generated in
another, and a graph in the third. All the analysis and modelling can be
done within Tracker itself. At Wildern a group of Year 10 students produced
a DVD of their project which includes a section demonstrating how to use
Tracker: www.ncetm.org.uk/iles/362726/Wildern+clip+2.avi .
When ilming motion it is important to keep the camera still, and not to
track the object, nor to zoom. Normally the motion being studied only
Modelling Action in Sports and Leisure
199
requires a few seconds of video, so access to editing software is useful. Some
formats may not be readable, so video conversion software can be useful.
There is now a new range of personal digital cameras capable of highquality video capture at speeds of 210 and 420 frames per second, and at
lower quality at 1000 fps. Figure 20.6 shows the capture of the service action
of Juan del Potro on his way to the inal at the 2009 ATP World Tour tennis
inals at the London O2 stadium last year. The video clip: ‘del potro.avi’ was
recorded at 210 frames per second using a Casio Exilim EX-FH20 high
speed camera with telephoto lens: www.casio.co.uk/products/Digital%20
Cameras/Exilim%20High%20Speed/EX-FH20BKEDA/Technical_
Speciications/.
The clip was imported into the Tracker software and the ‘tape measure’
tool was used to mark the distance between base and service lines as 5.5m.
Axes were added and titled. The path of the ball was tracked as a ‘Point
mass’ from the point of delivery by the server. The best-it line for displacement r against time t is found as r = 49.14 t + 0.05. This suggests that the ball
is moving horizontally from right to left at a speed of nearly 50 ms⫺1. This
Figure 20.6
Tracking the Speed of del Potro’s service
200
Mathematics Education with Digital Technology
110
d,v,a
(9.69, 99.2)
−0.004x 5 + 0.089x 4 −0.86x 3 + 4.27x 2
distance– time
DF
(7.37, 73)
DM
(4.08, 33.4)
DI
(0, 8.54)
10 AS
(4.08, 11.2)
VI
AI
O
−1
>> −10
(0, 0) 1
Figure 20.7
velocity– time (7.37, 12.9)
VM
0.00
AM
(4.08, 0) acceleration – time (7.37, 0)
(9.69, 7.38)
VF
9.69
t
(9.69, −6.09) 11
AF
TI-Nspire Analysis of Bolt’s 100m Run
compares well with the speed of 115 mph (or 184 kph) shown on the courtside display. You can download a video clip together with a Tracker ile from
which you can estimate the speed of delivery of a ball bowled by a young
cricketer from: www.ncetm.org.uk/Default.aspx?page=14&module=com&
mode=102&comcid=5265&comf=45648&comfb=1&comu=0. Figure 20.7
shows a more sophisticated example of mathematical modelling applied to
data from Usain Bolt’s Gold Medal winning 100 m sprint at the 2008
Olympics.
Conclusion
This article has concentrated on moving objects – which can include pupils
doing sports and PE. Of course there are plenty of opportunities for ICT
use to study the impact of exercise on pupils. Sensors such as heart-rate
monitors, temperature probes, balances, pressure pads, force gauges, and
so on can be used to measure aspects of performance. Another related ield
of study is biomechanics – which concentrates on the geometry of the
human frame – which can be modelled using CAD and geometry software.
Modelling Action in Sports and Leisure
201
Another concerns the properties of new materials developed for sports
clothing, such as swimwear. Yet another is concerned with the design of the
apparatus used for sports such as cycling, rowing, sailing, skiing, archery,
and so on. So clearly the ield of PE/sports is a rich source for ICT assisted
cross-curricular project work – especially for the STEM subjects.
Among other signiicant step forward is the introduction of a range of rugged personal sub-notebook computers running Windows XP by Intel based
on their new Atom processors. These Classmate PCs are speciically designed
for education within the ‘one laptop per child’ ethos. The current top of the
range model is a tablet PC with 60 GB hard drive costing around £300.
Another new device is a GPS sensor which plugs into the USB port of a
mobile PC, such as Classmate, or a mobile data logger, such as LabQuest:
www.vernier.com/gps/. An alternative approach is to use a hand-held GPS
navigation device, such as a Garmin eTrex: www.sciencescope.co.uk/pdf/
Page_by_page_catalogue/sciencescope-p08.pdf. In either case data can be
downloaded following a journey (e.g., on foot or by bike) for latitude, longitude and elevation against time for analysis for example, in Excel, and also
for geographical display in either Google Earth or Google maps. The data
captured by one or more sensors for example, heart-rate can also be displayed as a graph or using colours, and images captured en route can also
be displayed.
Part Seven
Case Studies of Teachers
Engaging with ICT
In this section teachers outline their own approaches to using Information
and Communications Technology (ICT) in the classroom to support pupil
learning and understanding. The issues surrounding ICT use are considered from different perspectives, for example from that of a Head of Department in a secondary school and from the point of view of Key Stage 2
practitioners. Some of the ICT used within these case studies is irmly established and recognized by practitioners as having merit in supporting understanding and learning. Newer technologies and those with little recognition
as classroom resources are also explored. It is often heard commented that
classroom use of ICT lags behind use in general society, it is interesting to
relect upon the reasons surrounding this issue, not only in terms of physical resourcing but also in terms of attitudes towards novel technology being
employed by pioneering teachers. What is deemed as acceptable use and
what might be perceived as either ‘just playing’ or even ‘cheating’?
Chapter 21
Teaching International Baccalaureate
Mathematics with Technology
Jim Fensom
United World College, SEA, Singapore
Introduction
IB diploma students select one subject from each of six subject groups.
Three are taken at higher level (HL), the others at standard level (SL). All
students must take a mathematics course. There are four different courses
designed for different types of students. Mathematical studies SL is designed
to build conidence and encourage an appreciation of mathematics in students not planning to continue their study further. Mathematics SL caters
for students who expect to need a sound mathematical background as they
prepare for future studies in subjects such as chemistry, economics, psychology and business administration. Mathematics HL caters for students
expecting to include mathematics as a major component of their university
studies, either in its own right or within courses such as physics, engineering
and technology. Further mathematics SL is for students who have a considerable interest in the subject. Students are expected to have access to a graphic
display calculator (GDC) at all times during each of these courses.
In the external assessment of these courses students also have access to a
GDC, except in non-calculator papers for mathematics SL and HL, but not
all questions will necessarily require the use of the GDC. In the internal
assessment of mathematical studies SL students can optionally make use of
technology, but in the internal assessment of mathematics SL and HL it is a
requirement as the use of technology is formally assessed.
Making the GDC required in examinations rather than being simply permitted led to a new dimension in the use of technology. When it was only
an optional tool, some teachers had paid little attention to teaching the
skills required to use it and similarly many students made little attempt to
206
Mathematics Education with Digital Technology
master those skills. Once it became a requirement, teachers took the technology on board and students paid more attention to using their calculators. As a result, it became possible to embed the technology in lessons.
What has been particularly rewarding is the way in which our studies students have had their interest in mathematics renewed as the calculator has
given them access to areas of mathematics that had previously been inaccessible to them. Another consequence has been the growth in the use of other
technologies such as graphing, dynamic geometry and data analysis software. While this had been possible before, somehow it never really took off
even though the software was available and training provided.
Let us take the introduction to the differentiation of sine functions as an
example of the use of technology in the teaching of the SL course. There are
many approaches to doing this ranging from a rigorous analytical one to
simply presenting the students with the result. This approach could utilize a
GDC or any graphing software. When students in the class are comfortable
with technology, there are many possibilities for introducing topics that do
not need the depth required in a rigorous approach. A better understanding can be achieved than from handing students unjustiied results.
y
1
0.5
y = sin( x)
90
1st Derivative of
y =sin(x)
180
270
360 x
-0.5
-1
I begin by getting the students to plot a sine curve and its irst derivative
with their calculators (or software) in degree mode. At irst sight the derivative curve is almost invisible as it runs so close to the x-axis. But, on closer
inspection, it is clear that there is a wave and that maybe it is a periodic
function with a very small amplitude.
The next stage is to experiment with the period of the sine function and
notice how, although the amplitude of the original function is unchanged,
that the amplitude of the derivative, clearly a sinusoidal curve, changes. This
Baccalaureate Mathematics and Technology
y
207
y = sin(5x)
1
0.5
1st Derivative of
y = sin(5x)
90
180
360 x
270
-0.5
-1
leads to the conjecture that it might be possible to ind a period that makes
the derivative have an amplitude of one, the same as the original sine curve.
After some trial and error and adjustment of the scale of the x-axis, it is
discovered that a value of approximately 57 for the coeficient of x yields
the appropriate amplitude. The x-intercepts of the modiied sine curve areapproximately π and 2π and, of course, 57 ⯝ (180 p ) . Thus the irst derivative
of sin ((180 p ) x) can clearly be seen to be cos((180 p ) x) leading to the idea of
radian measure.
y
1
y = sin(57x)
0.5
x Intercept
( 3.15 , 0 )
1
-0.5
2
3
4
5
6
7
x
1st Derivative of
y = sin(57x)
-1
In mathematics studies SL, students undertake a project worth 20 per cent
of their total mark. This could be from any area of mathematics. Access to
powerful software could result in students simply adopting an approach that
relied on, for example, a statistics package to do all the serious mathematical
work for them. It is possible, however, to enable students to make use of the
208
Mathematics Education with Digital Technology
software to perform more mundane arithmetical tasks, while allowing them
to interpret their results and to develop their mathematical insight.
One of my students, not one of the most mathematically able nor particularly interested in studying mathematics, was interested in football
and I encouraged her to choose a topic for her project that was based on
this interest. She took as her data the Premiership league table for the
previous season. The question she chose to ask was, ‘Which is more
closely related to the inal position in the league: goals for, goals against
or goal difference?’ She had learned about inding the least squares
regression equation and the product moment correlation coeficient in
class and knew how to get these with her calculator as well as how to put
the data in the formulas. This example shows how the use of a GDC to
enable a student to carry out a relatively sophisticated piece of mathematics can aid understanding of what that mathematics means in a very
effective way.
The data was irst entered into lists on the GDC. An example of what this
looked like is shown.
Scatter graphs of the three sets of data were drawn: goals against (GF)
and points (PTS), goals against (GA) and PTS and goal difference (GD)
and PTS.
The pictures alone provided a lot of opportunity for a meaningful discussion of the strength of the correlation and whether it was positive or negative. Next the equations and coeficients were calculated and the results
illustrated by graphing the regression lines superimposed over the data and
conclusions were drawn.
Baccalaureate Mathematics and Technology
209
An interesting extension to the original question was to look at inluence
that replacing goal difference with goal average had from the 1976–1977
season in the English Football League onwards. Another list was used to
calculate the goal ratio (GR) and this was plotted against PTS.
The evidence above seems to suggest that the use of goal difference was
justiied, certainly if only linear regression is to be considered.
Finally I would like to give an impression of the GDC skills that would be
required in the examination. The following example is based on a type of
question that might be found on an HL examination paper.
On the same axes sketch the graphs of the functions, f(x) and g(x),
where
f(x)=4–(x–1)2 for –2≤ x ≤4
g(x)=e(x–2)+2 for –2≤ x ≤4
The functions are entered into the GDC and their domains are used to
determine a suitable window for sketching the two curves. The sketch is
drawn from the GDC screen with axis labelling and scales added.
210
Mathematics Education with Digital Technology
Write down the equation of any horizontal asymptotes.
State the y-intercept of g(x).
The horizontal asymptote can be seen by inspecting the graph, together
with a little knowledge of the exponential function. (y=2)
The y-intercept can then be found directly from the GDC or by substitut~2.14)
ing x = 0 into g(x). (e–2+2⫺
Find the values of x for which f(x) = g(x).
This equation can be solved by inding the points of intersection of the
~ –0.381, x=2 )
curves. (x⫺
Let A be the region where .
On your graph shade the region A.
Write down an integral that represents the area of A.
Evaluate this integral.
The region between the two curves to the right of the y-axis is shaded.
2
The required integral is
4⫺(x⫺1)2 ⫺ e (x⫺2)⫹2 dx
冕 兵(
0
) (
)其
Baccalaureate Mathematics and Technology
211
A nice way to evaluate this integral using the GDC is to plot the function
~2.47)
f(x)–g(x) and use the graphical integration option. (A⫺
In the region A ind the maximum vertical distance between g (x)
and f (x).
Since the function f(x)–g(x) has already been plotted, all that is left to do is
~1.66)
to ind its maximum value. (maximum distance⫺
It is true to say that initially there were a number of teachers who felt that
this type of problem was debasing the examination. Even among students
there is still a common feeling that an ‘analytical’ approach is somehow
more valid than simply pressing buttons on a calculator. A closer look at
what is actually being examined by this question, however, reveals that there
is a lot more required in order to answer it than just pressing buttons. There
are other places in the paper where some of the more traditional skills can
be examined, but this style of question is suited for testing conceptual
understanding.
212
Mathematics Education with Digital Technology
Conclusion
I have intended through these three examples to illustrate different aspects
of the way in which technology contributes to how mathematics is taught
and learned in the IB. In the irst, I have tried to show how technology
based techniques can be used effectively to introduce topics to students
who are already familiar with using mathematical software or a GDC. The
second example shows how students who are not necessarily the most mathematically skilled can use relatively sophisticated techniques and develop
their understanding of mathematics without becoming lost in computation. Finally, I give an example of how the examiner can test the underlying
concepts of a problem and not simply the skills required to arrive at a result.
Technology has been incorporated into mathematics by the IB in a way that
has enriched the course and is motivating to the students. On the other
hand, these positive beneits may not always be as long-lasting as we teachers expect them to be. A former student said to me recently ‘I got out my
TI-83 Plus for the irst time since the last IB SL mathematics examination!
Woah . . . this thing looks like a space shuttle dashboard!’
Chapter 22
Why Use Technology to Teach Mathematics?
Andy Kemp
Head of Mathematics, Taunton School, UK
Introduction
The debate about the use of technology in the teaching of mathematics
continues on in schools up and down the country. Often it starts with
conversations about the use of the humble calculator – when do you
allow your students to use a calculator in class? The answer to this question says a lot about a teacher’s stance both on the use of technology and
also about what they consider the important elements of mathematics to
be. Is the calculator another tool in your students’ toolkit or is it something to be avoided wherever possible? Is using a calculator just a permissible form of cheating? Every mathematics teacher has an opinion on this
question and that tends to inluence their opinion on the use of technology in general.
My intention is to explore several aspects of how I use technology in my
day to day teaching, exploring the impact both on me as the teacher, and
also my students. I will try and outline the case for why technology in the
mathematics classroom is not something to be feared but something that
should be embraced for the beneit of our students. Some of the technology I will explore is inherently mathematical whereas others are more general, but all of them impact upon the way I teach mathematics.
Tablet PCs/IWB
The use of a tablet PC or interactive whiteboard is far from unique to the
mathematics classroom but it has huge beneits in the post-16 classroom
214
Mathematics Education with Digital Technology
when used thoughtfully and in conjunction with other technologies. For
the last 5 years I have taught almost every lesson using a combination of a
tablet PC and projector. I use a package called Microsoft OneNote as my
whiteboard environment – It enables me to keep my notes organized by
class on a collection of ininitely extendible pages. It’s a bit like having one
of the old roller boards but one where you can roll it back to any point in
the past and can always roll it forward to a new page. The advantages of this
may not be obvious at irst glance, but it enables me to quickly and easily
refer back to work we did at any point in the class and talk through past
examples or questions when leading in to a new topic.
The other great feature of this type of approach is that it is simple for me
to print off class notes for students who miss lessons for whatever reason.
More than that I actually convert my notes to a PDF document at the end of
each section or topic and make them available to the students to download
and review outside of class. This helps the students to get away from producing ‘perfect’ notes and instead concentrate on following and understanding the mathematics.
VLEs and Web Resources
The use of the internet in the classroom has exploded over the last few
years, although use in the Mathematics classroom is still mostly focused on
younger students, with a few exceptions. For a number of years now I have
been involved in running a school Virtual Learning Environment (VLE).
The focus of this work for me has been on providing resources and tools for
students to use when they are outside of the classroom, much of which is
based on helping them prepare for their exams. These resources take a
variety of forms with the aim of making it easier for students to ind the
resources they need at the point at which they need it.
On my VLE at the moment I have available for my students: class notes,
exam papers and mark schemes, video worked solutions to some exam questions recorded using the tablet PC or IWB with some screen recording software, handwritten (via tablet PC or IWB) worked solutions to exam papers.
In addition to this students can access multiple choice questions to practice
topics, and use discussion forums to ask questions of me and their peers.
The purpose of these resources is twofold; irstly to enable students access
to useful resources outside of lesson time, but equally importantly it is to
foster an increased degree of independence. By giving students easy access
to the information they need I have found that students take more ownership
Why Use Technology to Teach Mathematics?
215
over their study and are more willing to try and solve their problems themselves before coming to ask for help.
In addition to custom made web resources there are also several interesting online subscription resources such as the MEI Online Resources which
attempt to cover many of the features I outlined above for a variety of A-level
exam boards, or the MathsNet Resources which offer resources and activities for the A-level, Scottish Highers, IB and Pre-U syllabuses. These have
the advantage of being premade and already full of interesting activities
and resources, but the lip side is you lose the ability to customize the
resources to your individual school.
TI-Nspire
Another really useful tool I regularly use in my classroom in the TI-Nspire
system. This system is made up of a combination of hand-held graphical
calculator devices and accompanying computer software. The great strength
of this platform is its ability to explore multiple representations of the same
mathematical concepts. It is fundamentally a collection of linked tools, a
standard calculator, a graphing package, a dynamic geometry environment,
a spreadsheet, and a statistics package.
Initially I mostly used the computer software for demonstration purposes
at the front of the class. For example creating a function f1(x) and then
creating dependant functions such as f2(x) = f1(x+a) and using a slider to
explore the effect that changing the value of a has on the graph. This is a
really powerful way of exploring the various transformations of functions,
as it becomes simple to look at a variety of values for a as well as a variety of
starting functions.
216
Mathematics Education with Digital Technology
More recently I have started getting the students to regularly use the handheld devices in class. We frequently use the TI-Nspires to get a feeling for a
problem graphically before diving into the algebra. This has really helped my
students get a more intuitive feel for the mathematics. Also, since the TINspire has a document structure, it is possible for me to pre-create activities
and copy them for students to use on the hand-held devices. Some really
good examples of the kind of things that can be done with the TI-Nspire to
enhance post 16 teaching can be found on the Nspiring Learning website.
Autograph
Another technology I have used for a number of years is the excellent
graphing package Autograph For post-16 teaching it is an invaluable tool
for helping students to visualize much of the complex mathematics in the
course. In particular I ind it useful when teaching the 3D elements of the
course such as Volume of Revolution. Here I am able to draw and manipulate the volume generated by rotating a graph around an axis. One of Autograph’s great strengths in covering this topic is not only its ability to draw
the smoothed volume but also explore what happens if you ind the area
under the original curve using rectangles and then consider rotating these.
This helps students understand that we are really consider the sum of a
series of cylinders which in turn helps them appreciate where the formula
for the volume comes from. All of this can be done in just a few minutes as
part of a lesson, but can completely change a student’s understanding of
this topic. Similarly when I introduce Conic Sections I always use Autograph
to draw a double headed cone and plane and explore the shape of the
intersections. The ability to freely rotate the 3D construction really helps
students to visualize the ideas we are discussing.
Why Use Technology to Teach Mathematics?
217
Equation 1: y =1/x
Equation 1: r =z
Equation 2: y =az+b
I have outlined above just a few of the ways in which I regularly use technology
in my classroom and I hope you are able to see the potential impact this has
on my students. For me the overriding thing that technology enables me to
achieve is the ability to help students glimpse the links between the various
(artiicially) segregated topics in our curriculum. I want to help them see that
218
Mathematics Education with Digital Technology
the graphical and the algebraic are just two sides of the same coin and that
algebraic trigonometry work can still be explored geometrically. It is only as
students start to see these links that they realize mathematics isn’t an arbitrary
collection of disparate topics but rather a tapestry of interrelated ideas. For
me the central reason for using technology in the classroom is to help students see the vast and beautiful thing we call mathematics.
Conclusion
So having looked at some of the uses of technology in my classroom and
identiied some of the reasons why I chose to use them we must return to
our starting question about whether using technology is even an appropriate thing to do in the mathematics classroom. Back in 1995, Dan Kennedy
wrote the following:
Look around you in the tree of Mathematics today, and you will see
some new kids playing around in the branches. They’re exploring parts
of the tree that have not seen this kind of action in centuries, and they
didn’t even climb the trunk to get there. You know how they got there?
They cheated: they used a ladder. They climbed directly into the
branches using a prosthetic extension of their brains known in the Ed
Biz as technology. They got up there with graphing calculators. You can
argue all you want about whether they deserve to be there, and about
whether or not they might fall, but that won’t change the fact that they
are there, straddled alongside the best trunk-climbers in the tree – and
most of them are glad to be there. Now I ask you: Is that beautiful, or is
that bad? (1995, 460–65)
For me the use of technology in the maths classroom enables my students
to reach further and higher up into the tree of mathematics than they could
by themselves, and for me that is most deinitely a ‘beautiful’ thing!
References
Autograph www.autograph-maths.com/ (accessed on 5 October 2009).
Kennedy, D. 1995. ‘Climbing around the tree of mathematics’. Mathematics Teacher,
September 1995, 460–65. [Online]. Available from: http://mail.baylorschool.
org/~dkennedy/treeofmath (accessed on 5 October 2009).
Why Use Technology to Teach Mathematics?
219
Mathematics in Education and Industry (MEI) www.mei.org.uk/index.php?
section=onlineresources (accessed on 5 October 2009).
MathsNet www.mathsnetalevel.com/ (accessed on 5 October 2009).
Microsoft Ofice OneNote http://ofice.microsoft.com/en-gb/onenote/FX100
487701033.aspx (accessed on 5 October 2009).
Texas
Instruments
http://education.ti.com/educationportal/sites/UK/
productCategory/uk_nspire.html (accessed on 5 October 2009).
TI nspiring Learning http://nspiringlearning.org.uk/ (accessed on 5 October 2009).
Chapter 23
Using ICT to Support Learning Mathematics
in the Primary Classroom
Mel Bradford and Tina Davidson
Elm Grove Primary School, Brighton, UK
Introduction
There are many Information and Communications Technology (ICT)
resources available to primary teachers to support the teaching of mathematics. However there is less that supports the learning of this subject
through higher order thinking skills. With that in mind we planned a series
of lessons looking at the use of LOGO and the latest programmable toys in
the mathematics curriculum with Year 3 and 4 children.
In my vision, the child programs the computer and, in doing so, both
acquires a sense of mastery over a piece of the most modern and powerful technology and establishes an intimate contact with some of the deepest ideas from science, from mathematics, and from the art of intellectual
model building. (Papert, 1993, 2nd edition, p. 5).
Although there is some mention of programmable toys in the new Primary
Framework for Mathematics, for example, Year 3 in Block D, unit 2 that was
introduced in 2008, our learning objectives are taken from our school’s
ICT scheme from Wokingham, LA. Throughout the Primary Framework,
there are numerous references to ICT resources, but there is a limited reference made to programmable toys and Logo environments, often referred
to as a ‘Microworld’. When referring to a ‘Microworld’, we are taking the
deinition from BECTA/DfES (2003, p.16) as ‘a tiny world inside which a
pupil can explore alternatives, test hypotheses, and discover facts’. On the
other hand, the main ethos of the framework is that of Using and Applying
mathematics and problem solving which runs throughout all the blocks
Using ICT in the Primary Classroom
221
and to which Logo programming lends itself as a vehicle to cover many
areas of mathematics.
Year 3 and the Use of Programmable Toys
I chose nine mixed ability Year 3 children to work in groups of three with
a Pro-bot per group. Several of the children are very wary of mathematics
and are reticent in taking risks with their learning. Could this be the knock
on effect of ten years of the National Numeracy Strategy and a culture of
testing? Although our School has an ethos of encouraging children to
learn by their mistakes and for creative thinking, I am inding an increasing number of children coming to me in Year 3, totally switched off and
closed to mathematics especially when doing open ended investigations.
I hoped I would be able to reverse some of these effects through using the
Pro-bots, which children view as a ‘toy’, but through which I hoped to convey mathematical skills.
The irst activity was based on getting to know how to use the Pro-bot and
giving it simple instructions. Since Papert irst developed the Logo programming language in the 1970s and 1980s, children’s own use of computers has developed and become more intuitive as many more families
have a home computer. It was pleasing to observe that all children were
quickly and easily able to switch the Pro-bot on and give it simple instructions. At this stage it was very much a new toy to be played with before starting with any development of higher order thinking skills. When questioned
about previous experiences in school, they had all used Bee-bots and
Roamers in some context.
222
Mathematics Education with Digital Technology
Giving children the opportunity to ‘play’ before instructing them is an
important part of learning which with the pace of the primary curriculum
we often neglect in favour of spoon feeding. I just happened to go into a
Year 1 lesson where the teacher was instructing the children on how to turn
on and program a Bee-bot. Children have been playing with toys that need
to be turned on and buttons pushed to create different responses since
birth. Therefore they are adequately skilled to explore the basic functions of
a Bee-bot and Pro-bot, hence Bee-bots are now being used more in nursery
settings.
The next task was based on estimating a distance between a ixed starting
point and a ixed box. The children had to move the Pro-bot forward until
it stopped just in front of the box, without knocking it over or moving it.
Initially, I allowed the children to set about the task with no teacher input.
It was interesting to observe Frida (a wary and weak mathematician) using
her ingers spaced randomly apart at about 5cm, going along counting how
many spaces this would be to the box. When questioned on her choice of
non-standard measure, she was unable to give any form of answer, except a
shrug of the shoulders. This adds to my belief that as teachers we have
become ‘spoon feeders’, with the pressures of an overloaded curriculum
and government targets to be met, we no longer give children as many
opportunities of thinking and relecting on their own learning and so she
was unable to give any explanation. As Williams and Easingwood say ‘this
kind of process-orientated learning has slipped out of fashion in recent
years due to the demands and indeed the misinterpretation of the National
Curriculum and the National Numeracy Strategy’ (2004, p. 64).
At this point, I drew the group together and asked them to show me with
their ingers what Forward 1 represented. With relief I saw the majority had a
spacing of a centimetre, although when asked what they were showing it
ranged from 2mm to 1cm. We watched the Pro-bot draw Forward 1 and established it is 1cm. This is a great feature of the Pro-bots and different from the
Roamer and Bee-bot, which can be used for estimating non-standard measures. Using the Pro-bot we can now progress to the metric system for estimating distances. The activity continued a-pace with little intervention from me,
as I watched and observed some heated discussions taking place on the use of
various estimates ranging from reasonable to ridiculous. We had covered estimating and measuring length earlier in the term so the children had some
prior knowledge. It did seem initially there were plucking numbers from thin
air. One group, whose box was about 150 centimetres away, required the
command FD 150 (forward 150), but started with FD 79, then FD 100 and
then totally overestimated at FD 250 before some debate about what to try
Using ICT in the Primary Classroom
223
next. Eventually with much reining by increasing by variables of 1 or 2 the
Pro-bot came to a halt just before the box. In fact as the estimating was reined
and more precise, all groups were determined to get the Pro-bot just in front
of the box.
Since the children were already familiar with right angles, the following
lesson built on the estimation to the box by introducing angle commands.
First, pupils had to write a series of instructions to program the Pro-bot
from a starting line to go around the box without touching it and return.
Secondly, pupils had to reine their instructions to complete the task as
quickly as possible. Having got them to write out their program before trying it, they took to the task with enthusiasm. Once again, Frida was approximating the distance with her non-standard measure! And was still unable to
explain why she was doing so. It is worth mentioning that the wary mathematicians within the class, with the exception of Lee, continued to take a
back seat and complained they were not given an opportunity to program
the Pro-bot. They liked the idea of being in control of it, but were reluctant
to be involved with the decision making process even when encouraged by
other group members or myself. Others were embracing the problem solving and collaborative learning, including Lee, a very anxious and nervous
child who is terriied of getting a wrong answer. Lee worked with Rob, who
was taking the lead, but still listening to Lee’s input and trying out his suggestions or explaining why it would not work. They easily completed the
task using 90° turns and then started to reine their instructions, determined to get the Pro-bot around the box as closely as possible. Rob and Lee
were able as Williams and Easingwood et al. (2004, p.109) say
‘think Logo’. This means that they have to be able to act on their own
initiatives, work as a part of a team in collaborative manner, be prepared
to edit their own work and to accept that mistakes, or debugging, are an
integral part of the learning process.
This is where social skills and maturity comes into play. Discussion here is
about the mathematics being taught through ICT, however social interaction is an important life skill that can be enhanced through Logo environments. Where children take off with the higher order thinking skills,
especially a child such as Lee, it is great to observe as a teacher but it’s
those children who lack the conidence that need the most encouragement and challenge us in our role. The importance of questioning comes
into play and of kinaesthetic learning as a bridge to making connections.
We walked through the route the Pro-bot would take, discussing if it would
224
Mathematics Education with Digital Technology
be a left or right turn and used a metre stick to help estimate the distance
with a comparison. In retrospect, Marty and Frida had a disadvantage in
that they were working with Annie, a child on the gifted and talented
register for literacy but also an able mathematician, who enjoys a challenge
and will easily get on with a task independently of others. Group dynamics
does need careful planning and in this case did not work. Naomi and Carla
worked collaboratively, making estimates and reining their answers
through discussion and tried to include Laura in the process. They took
longer than the others to complete the task but were eventually successful
and pleased with themselves.
For the inal activity I created three different tracks on the carpet for the
children to program the Pro-bot to follow. All of them were used to doing
right angle turns through use of the Bee-bots and previous mathematics
lessons. I wanted them to explore estimating lengths and different angles of
turn, hence the tracks I created had no right angles.
The estimation of lengths was far better this time, although Frida was still
using her same non-standard measure. This time, it was Marty who asked her
why she was doing that and explained a Pro-bot moved forward in centimetres.
I later observed both her and Marty estimating a length in centimetres with far
more accuracy and being more co-operative within the group. It was interesting that the third member of the group, Annie, was over-complicating the
task. As I had said right angled turns were not allow, she was using multiples of
90 instead and had correctly calculated 4x90° = 360°. She was using this for an
angle of turn that was slightly bigger than 90° and was confused as to why it was
not working. Again I took the kinaesthetic approach and together we turned
4 right angles before repeating the same procedure with the Pro-bot and she
easily realized that all she was achieving was a complete turn. Frida was then
the one to suggest trying LT100 (left 100°) and from that her group were able
to reine their angle of turn and continue the task.
Rob and Lee set off with determination and zeal and were soon programming lengths and angles accurately and reining them to the nearest degree.
Another advantage of the Pro-bot is the visual screen where the instructions
are displayed and can be followed as they are being carried out. The arrow
keys then allow users to go to a line of code and edited it directly without
having to retype the whole program. This is extremely useful in that it allows
children to edit programs and they can immediately see the cause and effect.
This makes the whole process of logical thinking and manipulation easier
for them to ‘hold in their heads’. The beneit for Lee, who has dificulties
with ine motor skills, was the removal of the threat of having to put pen to
paper to record anything. A possible disadvantage is that children are then
Using ICT in the Primary Classroom
225
often reluctant to record the edits to their program on paper. However, if
they are reining the program and learning in the process, does recording
on paper matter or is it our teacher need for evidence of achievement?
Naomi, a quiet and diligent girl, was observed counting centimetres with
a inger space to ind the irst length. With some prompting she came up
with a reasonable estimate. I put a standard 30cm ruler against the tape and
from that she estimated a further 20cm. This swiftly developed into adding
multiples of ten and rounding their estimates to the nearest 10 (a skill they
had been learning earlier that week) before programming the Pro-bot. Carla
then realized the next length was about 3 ruler lengths and added 30+30+30
mentally. Together they suggested and tried out various angles of turn.
With only one exception, Laura, all the children were working collaboratively by the last session and had achieved the success criteria and fulilled
my learning objectives. More than that, they were well motivated and eager
to achieve the tasks. The looks on their faces showed how pleased they were
with themselves. Through the use of Pro-bots we had covered a range of
mathematical skills, including: estimation, measuring, angles, cause and
effect thinking and logical thinking.
Year 4 and the Use of Logo
Logo is the next step for children in that it is a computer program that
allows children opportunities to experiment, solve problems and reine
ideas on a computer screen. A small robot called a ‘Logo turtle’ appears on
a computer screen and understands a set of written commands, such as ‘RT
90’ (right turn, 90°) or FD 30 (forward 30 spaces); it follows the commands
to draw the corresponding lines on a screen. Children can learn to use
these commands to draw simple lines or shapes. They then move very
quickly to programming ‘procedures’ which are a set of algorithms or commands for a named pattern or shape. The simple programming language
can be used effectively as a tool to further improve the way children think
and solve mathematical problems as well as ‘teaching the computer’ to follow a set of commands.
Children at Elm Grove Primary School move into Year 4 with a wealth of
experiences of programmable Bee-bots, roamers and the new Pro-bots.
Their mathematical thinking is further developed by moving the children
away from the physical objects to the visual movements of the screen turtle.
This progress marries with the four stages of childhood development as
described by Jean Piaget the eminent Swiss psychologist who Seymour
226
Mathematics Education with Digital Technology
Papert worked closely with. Moving children from the Pre-operational Stage
(ages 2–7) to the Concrete Stage (ages 7–11) where the child starts to conceptualize, creating logical structures to explain their physical experiences.
Piaget says that ‘children have real understanding only of that which they
have invented themselves’. Logo allows this own experiential learning to
take place. This developmental progression demonstrates the approach to
Constructivism (Papert and Harel, 1991) (Resnick, 1996) based on the theories of Piaget. Constructivism ‘adds the idea that people construct new
knowledge with particular effectiveness when they are engaged in constructing personally-meaningful products’ (Resnick, 1996).
Piaget believed that children where not empty vessels to ill with knowledge but active builders of knowledge, constantly creating and testing their
new theories of the world.I was amazed when I looked closely at the Primary
Framework for Mathematics ‘Using and applying’ objectives for Year 4, as
working with Logo had the potential to cover so many objectives, from solving problems, to representing a problem as a diagram, organizing and
interpreting information to ind a solution, identifying patterns and relationships of properties of shapes. This was without objectives from other
strands of the framework such as, understanding shapes. The ICT medium
term plan for Modelling and Simulation involved learning objectives using
Logo, or a Logo-type program, to write procedures to create shapes; combine procedures to produce effects including changing variables. I was
therefore able to marry up the Logo modelling and simulations unit with
work on angles, directions, horizontal and vertical lines and recall work on
shapes and their properties from Block B unit 2 of the mathematics framework. This would also have cross-curricular links to Imaginary world’s literacy unit and our main Egyptian topic.
The irst session was used to reintroduce Logo and the basic commands.
The children could remember FD 100 and then RT 90 for a right angled
turn and quickly drew a square. They could also (much to my amazement
and without any prompting) remember how to change the colour of the
pen! The children worked in mixed ability pairs and were asked if they
could work out how to draw other polygons. While walking around and
observing I noticed that discussions on how for to turn the turtle were very
well estimated, not random guesses. The children had clear ideas about
90° and 180° and made close estimates and revision of angles to make
hexagons and octagons. Some pairs remembered 120° turn was needed
for an equilateral triangle. Others used trial and improvement to work it
out, amending and adjusting lengths of lines and angles to make their
shapes possible. As the class teacher I felt my role was to prompt with
Using ICT in the Primary Classroom
227
questions to enable the children to ind out for themselves and not give
them the answers. I felt that this could lead to Logo being a more effective
learning tool. Questions such as, If you know that the turtle turned a quarter turn or right angle at LT 90 is the angle you need more or less than
this? If the line was FD 25 how does the next line need to be longer or
shorter? Which direction will the turtle be facing when you have entered
that command?
The children had not remembered the repeat function from the previous
year so I reintroduced it for drawing some of the basic polygons. The children used the repeat function and shape knowledge to design and draw
pictures. In the following session I wanted to introduce the ‘procedure’
function to draw a square and add other procedures to call them names.
This was a major objective in the ICT modelling and simulations unit and
involved a lot of mathematical problem solving from Block D unit 2. I modelled it on the interactive whiteboard reproducing what I had done while
trying out Logo myself, irstly by writing a procedure for ‘a square’, then a
procedure called ‘line’, a vertical line of squares and then a ‘box’. Whilst I
was modelling the process there was a lot of class discussion, the children
were eager to join in and make suggestions about distances and angles for
the turns and were discussing which way the turtle would point with friends.
By the end of the demonstration the children saw how effectively the procedure could help them design a shape pattern, it could save time and energy
of writing out several times similar commands. In the same mixed ability
pairs, the children investigated writing procedures for a same shape design.
Each pair could choose the shape and create their own designs. During this
lesson there was a lot of discussion, pointing at screens, getting up and looking at friend’s designs and talking to them about it, revising designs and
changing the colour of pens. The children were extremely engaged and
learning. This was an exciting lesson, the children saved their work with
wonderful names relecting the designs they made, examples were ‘cool
star’, ‘snow spin’, ‘colourful snowlake’, ‘spitire’ and ‘staircase’.
From looking at examples where children printed their commands, I can
see that the writing of procedures was not used by many of the groups. They
worked out how to design their patterns without using this function but did
have long list of commands. In future lessons I intend to continue to work
with Logo, spending more time with the children learning how to writing
procedures and seeing the beneit of using them. They can use this for the
learning outcome of understanding that variables can be changed to allow
quick changes on screen, to produce new ever increasing or decreasing
shape patterns.
228
Mathematics Education with Digital Technology
From using Logo and continuing to use it to complete the unit of work,
I feel it has the qualities to enhance the teaching of mathematical thinking
and place early concepts on angles and lengths securely in children’s schemata for them to use as building blocks for future mathematical learning.
I feel that the screen turtle gave an instant visual representation of their
commands which would have taken a long time and probably have been
beyond the average year four child’s capabilities to draw. It allowed for trials
to be re-worked without crossing through or rubbing out. It enabled creativity and open ended research but through a directed task. On my part as
the teacher, I think the learning will only be of good quality if I continue to
practise at using logo and iron out some of my lack of knowledge of its programming capabilities. I need to devote more time to careful planning,
reviewing where the children have progressed to so far, in the use of writing
procedures. I need to work out a few simple directed procedures so that
they understand there function and capability. Then move on to changing
a variable in shapes and opening up the task to allow greater lexibility of
thinking and mathematical creativity. My questioning needs to be open and
draw the children to greater mathematical thinking.
Conclusion
We believe that it is our duty as teachers in an advanced technological world
to educate children to use, and learn mathematical concepts through using
ICT, indeed children have an entitlement to ICT in mathematics. Becta
2000 outlines ive major areas for learning mathematics through ICT: learning from feedback; observing patterns; exploring data; teaching the computer and developing visual imagery. On relection of our Logo and Pro-bot
work we can see that the children have opportunities for all ive entitlements. One of Logo’s main strengths is that children can learn from direct
and continue feedback from the visual. They are constantly making decisions about the distance for the turtle to travel, the angle for it to turn. The
turtle’s visual representation helps the children to ‘see’ the mathematical
concepts and ideas and to decide what to do next. Another entitlement
with ICT is ‘teaching the computer’. The DFES report on school mathematics of 1985 advises that for computers to be used as powerful tools for learning mathematics, children will need to learn to program, and that
if programming is not taught elsewhere, it should be included in mathematics lessons(DFES 1985 p. 35) Logo allows children to learn and
Using ICT in the Primary Classroom
229
develop in complexity a written programming language. Howe suggests
that the role of a programming language is ‘to provide the learner with a
‘kit of parts’. In the process of assembling the parts into a model, the
learner will come to understand its structure. (Howe 1979).
We think in primary schools it is Logo’s simplicity and yet diversity, from
the Bee-bot to the on screen programming, that has kept it in the forefront
of the mathematics curriculum as a way of introducing children to a mathematical way of thinking. It still has a standing as software that can aid learning of mathematics today.
References
Becta. (2000). Primary Mathematics:A Pupil’s Entitlement. http://ngl.gov.uk (accessed
on 18 March 2009).
Becta/DfES. (2003). ‘ICT and pedagogy’. ICT in Schools Research and Evaluation Series
No. 18 London: DfES publications.
Department of Education and Skills (DfES). (2003). The Big pICTure: The Impact of
ICT on Attainment, Motivation and Learning DFES/0796/2003
Howe, J. A. M. (1979). Learning Mathematics in the Classroom through Programming: First
Progress Report. Edinburgh: Edinburgh University
Papert, S. (1993). Mindstorms, Children, Computers, and Powerful Ideas. New York: Basic
Books.
Papert, S. and Harel, I. (eds). (1991). Constructionism: Research Reports and Essays
1985–1990, by the Epistemology and Learning Research Group, the Media Lab,
Massachusetts Institute of Technology, Corp, Norwood, NJ: Ablex Pub.
Resnick, M. (1996). ‘Distributed Constructionism’. Proceedings of the International
Conference of the Learning Sciences, Northwestern University.
Williams, J and Easingwood, N. (2004). ICT and Primary Mathematics: A Teacher’s
Guide. Abingdon, Oxfordshire: RoutledgeFalmer.
Wokingham LA: Primary ICT Schemes of Work. (2009). www.school-portal.co.uk/
GroupHomepage.asp?GroupId=142195 (accessed on 22 April 2009).
Chapter 24
The Role of a Head of Mathematics
Department in Ensuring ICT
Provision and Use within Lessons
Dawn Denyer and Carol Knights
Oriel High School and University of Chichester, UK
Introduction
Dawn Denyer is a Head of Department in a large secondary school in
southern England, with a sixth form . From her point of view, the issues surrounding using Information and Communications Technology (ICT) within
mathematics lessons fall into the following categories:
•
•
•
Availability
Ensuring that staff are familiar with a range of software and activities and
have the conidence to use these within lessons
Ensuring that all pupils have similar experiences within lessons – including
the use of ICT
Processes for addressing these have been developed and evolved over time
and also as the school has grown in size, and, although the challenges may vary
in different schools, the key elements will probably be broadly similar. Ensuring that teachers are familiar with software and activities plays a major part of
ensuring that pupils have similar experiences, so will be considered together.
Availability
The availability of PCs has reduced drastically recently with the tighter
controls on coursework in other subjects being implemented. This has
meant that pupils need to be timetabled for sessions in computer rooms to
complete their work and has inevitably led to far less ‘Open Access’ or
The Head of Mathematics Department and ICT
231
bookable time being available. Thus, any time that is available to Mathematics teachers must be used as proitably as possible. In order to facilitate this
and target key year groups, discussions with the person who devises the
whole school timetable have proved fruitful.
The lack of access to computer rooms has forced the department to ind
other ways to utilize ICT and familiarize pupils with a range of software
programmes. Each classroom has an Interactive Whiteboard, and one of
the challenges for teachers is to ensure that they do actually use the interactive features of the boards and also involve pupils in manipulating diagrams and operating software. By encouraging pupils to have hands on
access to software via an IWB, it means that when a class does have access to
a computer suite, they are more familiar with the software they are using
and derive more beneit from it.
Hand-held technologies provide another solution to having limited
access to PCs but also have a number of advantages. The screen of a handheld device is largely personal, whereas a PC screen can be seen by a number of other people. While this might be seen as a disadvantage, because
the teacher can’t instantly see what the pupil is actually doing on a handheld, since most hand-helds don’t have internet access, the pupil is unlikely
to be doing anything other than a mathematical activity! This also allows a
degree of privacy for the pupil and can be an enabler, allowing pupils to
feel conident enough to experiment and make mistakes, without them
being public. Hand-held technology also has the advantage of being more
easily able to be an integral part of the lesson rather than the main focus
of the lesson. A lesson in a computer room is often perceived as a computer lesson doing some mathematics and pupils are frequently expect to
use technology for all or most of the lesson. Within the usual classroom, a
mathematics lesson can take place during which some hand-held technology might be used to support learning when appropriate, which may only
be for a short part of the lesson. The only negative point to be noted is that
batteries often need replacing, which, while it shouldn’t be a reason for
not using them, is absolutely vital to the smooth running of lessons since
teachers who are reluctant to use ICT are often put off by this type of
problem.
Familiarity with Software and
Consistency across the Department
A Head of Department is ultimately responsible for the mathematical learning journeys of all pupils in a school. As such, Dawn feels it is important to
232
Mathematics Education with Digital Technology
ensure that all pupils in a year group have broadly similar experiences,
including experiences with ICT.
She also has to ensure that teachers meet the new Ofsted (2009) inspections requirements; ‘Resources, including new technology, make a marked
contribution to the quality of learning’. Although, it could be argued that it
is possible to use current software badly or to use older software effectively.
The important point is to use the most appropriate software to meet the
objective of the lesson, regardless of the age of the software. Indeed, there is
much to be said for using familiar software with pupils in order that they can
use it effectively. A number of software packages have a wide range of applications; teachers often use the same one for a variety of lessons which
improves both the teacher’s and the pupils’ conidence with the packages
and reduces the amount of familiarization time needed for both parties. A
balance must be struck between the beneits of using a more current piece
of software that has extra, useful features and the time spent in learning to
use it. The department has an extensive range of software to draw upon and
Dawn considers it is part of her role to ensure that new members of staff
gradually become familiar with the nuances of the variety available.
Becta’s guidance (2009) is helpful in raising teacher’s awareness of the
different types of usage that pupils should experience within lessons and
gives examples of how these might be achieved. The guidance refers in
the most part to commonly available software, which is especially helpful
to the department.
To enable teachers to be discriminate in their choice of software, it is
important that teachers are familiar with a range of software to enable them
to be in a position to make informed decisions. As the Schemes of Work have
evolved, suggestions for use of ICT to support pupils’ learning have been
incorporated and are regularly reviewed and updated. The Schemes also
indicate when it is expected that pupils should use ICT. To support each
other, the department often use regular meeting time for teacher led sessions
exploring activities that could be used in forthcoming lessons, including
familiarization with a range of software and discussion about how ICT might
enhance activities, both within the usual classroom and in a computer suite.
Teachers within the department tend to use ICT in ways which are in
keeping with their usual pedagogical approaches and within their own
competencies and conidence with the software. Lessons involving ICT
often require teachers to relinquish some degree of control to pupils, in
order for them to explore a problem, and this can prove challenging for
those teachers who like to have a stronger element of teacher control within
their ‘usual’ lessons. Peer observation has a role to play in helping teachers
develop their repertoire of pedagogical approaches, but the practicalities
The Head of Mathematics Department and ICT
233
of organizing this often proves prohibitive. Modelling lesson structures
within professional development sessions helps teachers to appreciate the
power of allowing pupils to take some responsibility for making decisions
within their work. The purpose of lesson modelling is twofold; empowering
teachers to use software and trial activities builds conidence and also helps
to ensure that these activities are used with pupils across the year group.
Conclusion
As pupils become used to a higher level of ICT usage and graphical sophistication within society, it becomes more important to engage them through
these familiar means. There are many ‘visual’ beneits gained through using
ICT packages; mathematical diagrams can be accurately drawn for example,
graphs, transformations, geometrical diagrams, and more dificult concepts
can be modelled for example, velocity-time graphs and families of differential
equations. This does not negate the need for pupils to be able to draw graphs
or geometrical diagrams or to calculate values for continuing sequences.
There is a careful balance to be struck between letting pupils manipulate
scenarios created for them, say for example, to investigate circle theorems,
and understanding the mathematics required to construct the scenario
themselves. Using technology effectively can also allow the teacher more
time to ask relevant probing questions or allows pupils more time to investigate mathematical situations without spending time on the construction of
the problem.
The technology doesn’t have to be the most up-to-date, it is possible to
get as much out of pupils sticking matchsticks or counters on to a projected
image as from using an IWB. However, software should be used when it is
the most appropriate resource and teachers need to be in a position to recognize when it is. They need to see the relevance of using a particular piece
of software or technology, so when opportunities arise to demonstrate this,
they need to be capitalized upon.
The Head of Department has a key role to play in continuing to drive ICT
use forward and ensuring that all teachers and pupils have access to, and
use, appropriate resources.
References
Becta. (2009). Secondary Mathematics with ICT: A Pupil’s Entitlement to ICT in Secondary
Mathematics. Coventry: Becta. www.teachernet.gov.uk/teachingandlearning/subjects/
ict/bectadocs/sec/ (accessed on 30 June 2009).
Ofsted. (2009). The Evaluation Schedule for Schools. London: Ofsted.
Chapter 25
Developing Problem Solving Skills and
Cross-curricular Approaches in Mathematics
Utilizing ICT
Michael Hartnell and Carol Knights
Henry Cort Community College and University of Chichester, UK
Introduction
As a Head of Department in an 11–16 specialist Sports College in Southern
England, Mike’s teaching philosophies are to engage pupils through meaningful activity, to promote independent approaches to learning and to challenge pupils to think deeply and mathematically about substantial problems.
He believes that Information and Communications Technology (ICT) has
a role to play in supporting learning in a range of ways. Some of the technology he uses could be classed as mathematics software, whereas others
are more generic and some are quite unusual in a classroom, perhaps
stretching the deinition of what is generally considered to be included as
ICT use for learning in schools.
Mike uses ICT effectively in lessons to support pupils in solving problems
that are real to them. These problems are drawn from familiar contexts and
from the pupils’ surrounding environment, which often means that the
problems also have cross-curricular applicability. Problems might be quite
short and it within a single lesson, or might require a series of several lessons to solve them. Regardless of the timescale, the classroom problem solving process will often follow a similar format:
•
•
•
•
An initial problem is posed
Pupils gather data (and record it)
The data are analysed
Conjectures are made
Developing Problem Solving Skills
•
235
Conjectures are tested and rationalized relating back to the initial
problem
Within different problems, Mike and his pupils use ICT to support activity
at one or more of the phases. The examples that follow outline a range of
problems and the software that has been used to support the different
phases within this classroom problem solving progression.
One of the irst cross-curricular activities that Mike used arose from a natural situation in which he wanted to give pupils a better understanding of
quadratic equations, partly in response to a remark from a pupil asking what
the point of the graphs were. To help pupils visualize the shape of a quadratic
graph, he had the idea of taking them outside to a basketball court and videoing them trying to score a basket. He then showed the pupils how to use a
free piece of software ‘vidshell’ together with a dynamic geometry software
package to analyse their attempts, which they did in pairs on PCs.
This starting point then grew through Mike discussing the activity briely
in a staff meeting. One of the Design and Technology teachers immediately
recognized links to a ‘ping pong ball launcher’ project and the two then collaborated, together with Science, to link the work the following year. The
activity, which was also ilmed by Teachers TV, enabled the pupils to make
links between the subjects and transfer skills from one session to another.
Software allowed pupils to not only ind the equation of the trajectory but
also to explore the angle of projection, to calculate maximum heights, ascertain speeds and collect data to draw accurate distance-time graphs. By capitalizing on the activity to access a range of content within different subjects,
pupils gained a much deeper understanding of quadratic graphs, in a genuine context. Mike believes that carrying out activities for themselves, rather
than relying on prepared video clips, helps to personalize lessons and aids
pupil motivation as well as giving them a much better insight.
This activity has been used in subsequent years and the Mathematics
Department timetable their part of the input to the activity to coincide in
with the Design and Technology Department’s scheme of work. This can be
slightly problematic, but Mike argues that the beneits for the pupils, being
more able to transfer skills from one subject to another and the greater
insights they have, far outweigh any drawbacks. This particular activity utilized ICT at many of the phases of the classroom problem solving process:
to gather and record the data, to analyse it, to assist in making conjectures
and again to support in testing them.
A prime example of an activity that has promoted a much more concrete
understanding of mathematics is the use of a dance mat to support learning
236
Mathematics Education with Digital Technology
about 2-dimensional and 3-dimensional vectors. Inspired by a local colleague who had used dance to motivate some underachieving girls, Mike
brought a dance mat into the classroom. Beginning by considering mathematical notation to describe simple single moves forwards, backwards and
sideways, pupils then began to build notation into their own sequences.
Posing a new problem of a popular dance which required a stooping movement, pupils moved quite naturally into using three dimensional notations.
The level of mathematics encountered by the pupils was far above that
which they might usually achieve. Mike believes that the activity would not
have been as successful if it were not for the use of a computerized interactive tool for the irst phase of the problem solving process which allowed
pupils to access the problem in a very natural way.
Another of Mike’s strategies within lessons is to pose an interesting and
non-trivial question such as ‘Left-handed people are better at sport than
right-handed people’. Pupils are then free to use internet search skills and
any other data collection techniques appropriate to decide whether this is
true or not. This is not a particularly sophisticated level of ICT use, but it is
challenging for pupils to extract relevant data from the plethora available –
and would be far more dificult without ICT. In an information rich society,
these skills are becoming increasingly important. This activity also enables
cross-curricular links, in this case with physical education, to be exploited.
Posing questions that are real and relevant to pupils is something that he
encourages. With this type of question, pupils can choose to personalize the
problem by considering a sport that they are more interested in. This type
of activity means that the role of the teacher is altered to responding to
pupil’s individual questions and needs when required, and the variety of
questions is more wide-ranging than if the class were all exploring exactly
the same problem.
Hand-held devices such as graphical calculators are regularly used to support learning within lessons. Being portable, they are easy to integrate
within lesson planning for any part of a lesson rather than having to book
computer facilities for whole lessons. This allows the use of ICT to occur
more naturally within the lesson rather than feeling slightly contrived, as
can happen when a computer room has to be booked in advance. Building
familiarity with the graphical calculators helps to develop pupils’ problem
solving skills; a measure of success being that pupils recognize when they
will be useful in helping to solve given problems.
One unusual use of ICT that the department has pioneered, and is somewhat controversial among some staff, is the use of a set of Nintendo DSTM
Originals with target groups before school. This has proved extremely
Developing Problem Solving Skills
237
successful in motivating pupils to practise basic number skills and has
improved both their mathematical competence and conidence in lessons
across the curriculum. Initially aimed at a Year 7 group during the summer
term for one morning a week, it has grown as pupils moving on to higher
year groups have insisted they wish to continue. The department currently
run the sessions every school day and have pupils from Years 7 to 9 attending. The sessions are so oversubscribed that ‘disappointed’ latecomers have
to make do with using the PCs instead of the hand-helds. Concerns raised
were that the devices tend to offer drill and practice and that the ‘novelty
value’ would soon wear off, but Mike counters this with the fact that some
pupils are in their third year of attending, that drill and practice has it’s
place and that other games are used, particularly one that requires mathematical problem solving and logic skills. These types of games help to
build a pupil’s repertoire, enabling them to draw upon a wider range of
skills in future.
One of the more established items of technology the department uses is
the Texas Instruments Calculator Based Ranger (CBRTM), an ultra-sonic
motion detector which is used to explore distance-time and velocity-time
graphs and provides obvious links to similar work in Science. Pupils are
able to make connections between the movements they make and the ‘living’ graph which is simultaneously produced on the screen, giving them a
better understanding of how the graph is created and what the different
features of the graph relate to in real life. Mike believes this particular technology is very effective in what it does and so it still has a place within the
departments’ repertoire. Activities using the CBRTM can involve the use of
technology in all phases of classroom problem solving, it encourages conjecturing and data can then be gathered and analysed to support or refute
pupils’ conjectures. It is the immediacy of the process together with the
interactive nature of the activity which helps to engage and motivate pupils
as well as enhance their understanding.
Conclusion
Mike is keen for pupils to encounter a wide range of real problems and to
become critically selective in the ICT they choose to use to support their
problem solving efforts. This is a long-term process which requires teacher
time to develop activities but also necessitates a move away from didactic
teaching methods in order to facilitate pupil autonomy. Utilizing opportunities for cross-curricular activities and contexts has proven successful in
238
Mathematics Education with Digital Technology
improving pupils’ motivation but more importantly in deepening pupils’
understanding.
References
Hard to Teach: Quadratic Graphs, Teachers.tv www.teachers.tv/video/19119
Nintendo DS, www.nintendo.co.uk/NOE/en_GB/
Texas Instruments http://education.ti.com/educationportal/sites/UK/homePage/
index.html
Vidshell software www.webphysics.ccsnh.edu/vidshell/vidshell.html (accessed on
27 March 2011)
Part Eight
Implications for Professional
Development
The subject content of the mathematics curriculum has changed relatively
little in the last 25 years or so, as has, by and large, its examination and
assessment system. Teachers have always been quick to embrace new technologies which make their professional lives easier, from Banda machines
and photocopiers to learning platforms, e-mail and the internet. In both of
these respects it would appear that serving mathematics teachers feel competent in what and how they teach – and would not identify these aspects of
their work as priorities for their own continuing professional development
(CPD). However it is lack of professional development, coupled with lack of
time, which are usually identiied as the main reasons for the very slow pace
with which schools have been incorporating mathematics speciic technologies into their own teaching and learning strategies. If that situation is not
to perpetuate, innovative approaches to teachers’ CPD and support (mutual
and external) need to be adopted. This section includes contributions from
a number of experts in different ields of such teacher CPD and support.
Chapter 26
Supporting Developments within a
Local Authority
Ron Taylor
Hampshire Inspection and Advisory Service, UK
Introduction
This case study covers a period of almost 20 years of the Hampshire Mathematics Inspection and Advisory service. Initially Hampshire LEA included
both Southampton and Portsmouth with over 120 secondary and about 800
primary schools and many other centres for nursery and special education.
The introduction of unitary authorities between 1995 and 1998 reduced this
but it still has some 70 secondary and approximately 450 primary schools.
Providing advice and support for this number of schools over such a geographically dispersed area is a challenge. In the early years sharing and dissemination of practice was largely carried out through networks of single and
cross phase groups, with meetings of 2–3 hours each half term. Over time
these have been reinforced through the introduction of the Leading Mathematics Teacher (LMT) scheme, curriculum leader and professional development groups with speciic teaching and learning foci. These have been of
varying duration and intensity depending on the nature and focus of the
group. Partnership and collaboration with higher education (HE) has been
a key component of the work with schools. In the secondary sector the University of Chichester has played a signiicant role in the design and delivery of
CPD, supported by Kings College, London, universities of Southampton and
Cambridge, and the London Institute. Models of CPD which appeared to
have the greatest impact, including those involving Information and Communications Technology (ICT), contained the following elements:
•
Joint planning with LA inspector/adviser, secondary consultants (post
National Secondary Strategy) and HE
242
•
•
•
Mathematics Education with Digital Technology
Interpreting and relating national priorities to school priorities
In-school support and advice with adviser/consultant
Time for teachers to report and relect on the impact of new approaches
and ICT tools used.
Where Did It All Begin?
The following is an extract from the paper presented at ICTMT95 (International Conference on Technology in Mathematics Teaching 1995). It is
given as an example of how Hampshire’s model of CPD developed, not
only in ICT but in other areas such as Transition, Assessment for Learning, and
Motivation and Relevance for 14–19 students.
The Hampshire Evaluation of Personal Technology in
Motivating and Understanding Mathematics (The OPTIMUM)
In 1993 the Department for Education asked NCET (National Council for
Educational Technology, now Becta) to manage a pilot evaluation study to
assess the curriculum value of portable computers in schools in England. Proposals were invited from LEAs and teacher training institutions. A joint bid
was made by Hampshire and the University of Chichester (formerly Chichester
Institute of Higher Education). The main project aim was to establish:
How ready and continuous access to portable computers could enhance
pupils’ problem solving skills and enhance their mathematical knowledge.
There were three sub projects in three different 11–16 schools, each with
different equipment and software.
1. A portable printer and 16 laptops, with the following software:
– MSWORKS, combined word-processing, database, spreadsheet
– Cabri Geometry, dynamic geometry software
– Mathcad
– Derive
2. 30 personal organizers, Hewlett Packard HP95LX palm-tops with in-built
graphic calculator and spreadsheet, and plug in Derive card.
3. Graphic calculators, Texas Instruments; 32 TI81, 14 TI85 (included link
software for printing or downloading programs and data).
Developments within a Local Authority
243
Training and Support
The NCET provided all of the hardware and most of the software, however
there was no provision for training, advice or support. This was funded by
the LEA, HE and the schools and consisted of half a day on technical and
management issues with 3 or 4 days work in schools.
In order that these new IT tools were integrated naturally into the mathematics curriculum the scheme of work was chosen as the starting point.
Various aspects of content and associated mathematical tasks were analysed
to establish how the particular equipment might be used to enhance pupils’
mathematical learning. This often meant adapting or designing new tasks
of an exploratory nature. Further technical support and training was provided when necessary. This varied according to the complexity of the
machine and the ‘newness’ of the range of software that was available, as
was the case with project school 1 when whole staff INSET was requested on
the use of Cabri and Mathcad.
Staff from project 3 school also attended short courses on graphic calculators being offered to local schools by the Hampshire Maths Team.
School Management of ICT Tools
To ensure pupils had ready and continuous access, including when necessary use at home all schools sent letters to parents outlining the schools’
and pupils responsibilities.
In project 1, all pupils and staff had access to the computers. Each
machine had a log book to monitor pupil usage. Pupils could also book the
laptops for the completion of assignments at home. The department had a
policy of encouraging pupils to independently select resources and equipment as and when appropriate. This was extended to include the newly
acquired laptops.
In project 2, the personal organizers were given to a particular class of
Year 10 pupils for the duration of the project and all parents were invited to
a meeting to share the project aims. The organizers were carried around at
all times throughout the school day and taken home.
In project 3, each pupil in one Year 10 class was given either a TI81 or
TI85 for continuous use, both in school and at home. The TI85, being a
much more complex machine, was given to those pupils who were considered more conident in using ICT. This left the class set of TI81s for shared
use by other staff with other classes.
244
Mathematics Education with Digital Technology
Examples of Use
Project 1
In the irst instance much of the use was initiated by the pupils. In particular the word processing facility was immediately accessible to pupils and was
used across the curriculum for writing up coursework in subjects such as
science and geography. Pupils had ready access to the laptops and often
took the machines home. Several, including the less able, learnt how to use
the MSWORKS independently. Some utilized the spreadsheet in their geography coursework assignments.
Examples of problems chosen across the age and ability range and
include:
•
•
•
•
producing multiplication tables, use to familiarize pupils with the format
and facilities of the spreadsheet;
divisibility explorations, for example, ‘when is the consecutive product
of three numbers divisible by 24’;
modelling and solving resulting simultaneous equations over Integer
and Real numbers;
entering and analysing data from a variety of surveys.
Some use was also made of Cabri. In particular a Year 9 bottom set with a
high proportion of pupils with special needs used the dynamic geometry
package to investigate the ratio between opposite and adjacent sides of a
right angled triangle (initially with angle of 300). In the irst instance, to
familiarize them with the facilities of the software, they were given the task
of producing a picture of their own choice such as face. Within the space
of 50 minutes pupils could conidently construct circles, triangles, symmetrical points, measure angles and line segments. When constructing
their right angled triangle they developed a range of strategies to create
and measure the angles, perpendicular lines, and so on. Discussing with
pupils the ways in which they might construct their triangle using the
menu options of Cabri was both illuminating and challenging for the
pupils.
Other classes used Cabri to make conjectures about a variety of angle
properties in a circle such as; ‘the angle at centre is twice the angle at
circumference’, and the special result ‘the angle in semi-circle is a right
angle’. In the latter stages of the project they explored other trigonometric
ratios and the use of Cabri to develop pupils’ understanding of locus and
application to linkages.
Developments within a Local Authority
245
Project 2
Year 10 pupils.
Pupils used a wide range of facilities available on the personal organizer
such as:
•
•
‘memo’ facility for taking notes in non-mathematics lessons and for writing coursework;
appointment diary and phonebook for working out holiday currency
and imperial to metric conversions (e.g., holiday exchange rates).
The in-built spread sheet was used for:
•
•
•
•
problem solving, modelling, solving resulting equations using trial and
improvement;
compound interest;
simulation of dice games;
helping with family business accounting.
The graphics calculator facility on the organizer was used for:
•
•
•
normal calculations (c.f. scientiic calculator but with bigger screen and
ability to see several previous calculations) in maths and other subject
lessons;
graphical solution to linear and non-linear equations (only one graph at
time possible, so solution of simultaneous equations required pupils to
make appropriate algebraic manipulations);
modelling problems such as ‘max box’ and use of solver to draw graph
and ind turning points.
Use of Derive:
•
•
•
•
exploration of divisibility for example, for what values of m and n is 2m+3n
divisible by 7;
exploring fractional powers and surd equivalents produced by Derive, for
example, why 99½= 3√11;
factorizing/solving/graphing quadratic forms using Derive to check,
manual manipulations;
modelling for example, exploration of fairground rides such as locus of
the ‘Tea-Cup’ ride using parametric coordinates and trigonometry.
246
Mathematics Education with Digital Technology
Project 3
The two types of graphical calculators were used in several areas of the
mathematics curriculum.
A Year 10 group taking a GCSE in statistics made extensive use of the
statistical features on both the TI81 and 85. Although the TI85 was a much
more complex machine and less accessible than the TI81, its facility for
transferring data between machines, obtaining hard copy of data, programs
and screen dumps was a bonus for pupils and staff. The hard copy was particularly useful for coursework assignments. Initially the TI85s were placed
with a particular set of pupils, but once initiated on the TI81 pupils transferred from one to the other with ease. Some examples of their use
included:
•
•
•
•
•
•
Graph work: establishing equation of straight line, meaning of m and c
in y=mx+c, quadratic functions arising from the product of two linear
functions, relationship with their roots and graphs graphical solution of
linear and non-linear equations, modelling and using graphical facilities
to solve resultant equations;
Sequences: generating number chains using a pre-loaded or given program, pupils adapting and changing the program to generate chains of
their own;
exploring geometrical designs ‘Polygons and Stars’ using parametric
and trigonometric functions;
Tessellations: adapting a simple program that draws a tile to create tessellations, used to help pupils understand the idea of a generalized
translation;
Statistical work: surveys use of mean and standard deviation to compare
sets of data, exploring the effect of changes to data on mean and SD.
Also, establishing appropriate class interval by observing changes to the
histogram as the interval is altered;
Incidental use in other subjects such as science and geography.
Main Findings
•
Frequent or continuous access to portable equipment which allowed
pupils to work on problems outside normal mathematics lessons and at
home led to pupils taking greater responsibility for their own learning.
Developments within a Local Authority
•
•
•
•
•
•
•
•
247
They would often extend and explore new problems independently.
Allowing pupils to take equipment home increased their sense of responsibility and self esteem.
Technical support is important in the early stages to ensure the IT supports rather than hinders pupils’ mathematical learning. This is particularly true with the more complex hardware/software as in projects 1
and 2.
Some of the greatest gains in mathematical learning have been among
those pupils who have had continuous access to the portables at school
and at home. However, following a policy of equal access for all staff and
pupils results in greater staff involvement, sharing and exchange of ideas
and evolutionary integration of IT into the mathematics curriculum for
all pupils, albeit at a slower rate.
The constant feedback provided by the use of IT in mathematics allows
pupils to independently explore the effect of changes they make to
their model, numerical data, graphical and geometrical images. Patterns can be observed, conjectures and generalizations made and
tested.
Ensuring that pupils evaluate and make appropriate use of the IT when
doing mathematics requires suitable teacher intervention and questioning.
Even with committed staff two terms or even a year is too short a period
to discern permanent beneits. The developments in the second year
have been far more rapid than in the irst. This is particularly true with
the graphic calculators. The narrower focus and ease of use of equipment has already led to extensive use by the majority of staff and good
integration into the scheme of work.
A set of graphic calculators can be purchased for the price of a single
computer. Continuous access to this power for all secondary pupils is a
real possibility.
Pupils make more informed choices on the use of IT in mathematics as
they become more familiar with the range of facilities offered. This does,
however, require staff to be lexible in the way in which they manage
pupils’ learning, in particular how they allow pupils to access resources
and equipment.
Teachers need planned support to help them explore the full potential
of ICT in the teaching and learning of mathematics. It is important that
teachers are given suficient time, INSET and advice to develop the use
of ICT in mathematics. This should include time for sharing ideas with
colleagues in their own school and in other schools.
248
Mathematics Education with Digital Technology
What Happened Next? (Part 1)
For Hampshire
•
The experience and knowledge gained during the pilot project was
invaluable in enabling both Hampshire and the University of Chichester
(UoC) to devise the joint training, advice and support programme for
other Hampshire secondary schools.
Nationally
•
•
•
Results from the pilot contributed to national CPD developments on use
of ICT in mathematics.
In 1994–1995 the DfE (now DCFS) provided monies (c£25m total with
c£2m for secondary mathematics) to schools through GEST (Grants for
Education Support and Training), targeted at curriculum use of ICT. Ideas,
materials and approaches to teaching and learning were incorporated in
materials distributed to all schools participating in this programme.
Collaboration between suppliers, manufactures, UoC, Hampshire Mathematics Team and schools helped to inform the design and use of new
ICT tools.
The irst GEST ICT programme offered substantial support for hardware,
software and CPD. In the UoC/Hampshire collaboration the CPD provision consisted of 5 days training, 5 days for schools to develop materials,
visit other project schools and share ideas and approaches to teaching and
learning, and 2–3 days in-school adviser support. There were 12 participating secondary schools with the CPD provision being spread over one academic year to enable time for trialling and relecting upon new ideas,
approaches and ICT tools. The teachers could also use their work in the
project as part of a MA module.
GEST funding for ICT was also provided for 1995–1996 and a further 12
Hampshire secondary schools opted to take advantage of this provision.
What Happened Next? (Part 2)
Outcomes and materials arising from the various projects were shared at local
network meetings and the annual Heads of Department 2 day conference.
There were regular collaborations with UoC and funding support from
Developments within a Local Authority
249
manufacturers and suppliers such as Texas Instruments through their T-cubed
INSET programme. These helped to support 2–3 day training courses for
about 20 schools per course over several years. Alongside these courses there
were some small scale classroom based research projects. The following gives
some idea of the scope of these:
•
•
•
•
•
•
‘Data-capture and modelling in mathematics and science’ funded by
NCET ,
‘Cross-curricular project’ supported by the TTA (now TDA, Teacher
Development Agency).
‘Dynamic geometry project-using the TI92’ supported by Texas
Instruments.
‘Linking algebraic and geometric reasoning with dynamic geometry software’ funded by QCA and supported by Ken Ruthven University of Cambridge, and Adrian Oldknow, UoC, and Hampshire’s leading mathematics
teachers.
‘Partners in learning cross-curricular project-uses of ICT to facilitate collaborative approaches to teaching and learning’ a joint Microsoft/TDA/
Hampshire Partners in Learning project.
‘Working with 3D Geometry software in KS3 & 4’ Adrian Oldknow, Ron
Taylor and Hampshire leading mathematics teachers.
Dissemination and Sharing Good Practice
The background to the structures and networks in Hampshire was
described in the Introduction. It is these, along with a culture of joint and
collaborative practice across schools, and between HE and the LA, that
have been key in enabling the dissemination and sharing of good practice.. The involvement of the mathematics consultants, Leading Mathematics Teachers and other key teachers has increased the capacity of the
LA to disseminate the teaching and learning research outcomes across all
its secondary schools. In 2005 ‘Factors inluencing the transfer of good
practice’ brief No. RB615, University of Sussex and international think
tank Demos identiied a number of key recommendations, the following is
the irst:
Developing joint practice development capacity across the system (R1).
LEAs should demonstrate their belief in certain kinds of collaboration.
They should not only consider making joint practice development a way
250
Mathematics Education with Digital Technology
of implementing a range of EDP priorities, but also make joint practice
development a priority in its own right. In addition they should work with
other LEAs to share their own practice. All of these activities would be of
practical as well as symbolic signiicance.
Conclusion
It is also worth mentioning the report on the work of de Geest et al in 2007.
In it they outlined the following factors that contributed to effective CPD:
•
•
•
•
•
•
•
•
•
•
Leadership (of the CPD);
A practical approach;
Stimulation, challenge and enjoyment;
Time;
Networking;
Area of focus (mathematics);
Students‟ learning of mathematics;
Encouraging relection;
Expecting and supporting change;
Supporting the embedding of change.
It is to be hoped that all of these are embedded within any LA and other
coordinating bodies of CPD.
Chapter 27
Supporting Teachers in Introducing
New Technologies
Alison Clark-Wilson
The University of Chichester, UK
Introduction
My role as a teacher, lecturer and researcher in mathematics education has
enabled me to work with hundreds of (mainly) secondary mathematics teachers over the last 15 years, all of whom have wanted to develop how they make
the best use of the available digital technologies in their classrooms to support their own teaching – and their students’ learning. Although some of the
available technologies have developed signiicantly in this time, for example,
interactive whiteboards and classroom broadband internet access, other
resources have essentially the same mathematical features such as function
graphing packages. What has been most apparent in this period is that the
processes through which teachers learn about and ind uses for digital technologies follow some very similar patterns of behaviour, which is borne out by
the substantial research that exists on this topic (Laborde 2001; Monaghan
2004; Noss et al. 1991; Pope 2001; Ruthven and Hennessy 2002).
Among the Information and Communications Technology (ICT) visionaries in mathematics education there have been some big claims concerning the way that ICT might enable us to rethink the actual mathematics we
teach in schools and the experiences through which our students come to
learn it (Goldenberg and Cuoco 1998; Kaput 1986; Noss 1998; Noss and
Hoyles 1996; Papert 1980). The essence of their arguments concern the
fact that we might spend less time in classrooms ‘telling’ students about new
mathematical knowledge, albeit with sophisticated digital demonstrations
252
Mathematics Education with Digital Technology
and animations, and provide more opportunities for the students to arrive
at this knowledge through exploratory tasks that use digital technologies to
support students to construct mathematical meanings of for themselves.
So the irst dilemma we face in thinking about how we might begin to
integrate digital technologies into our classrooms concerns the following
set of questions:
z
z
z
z
Which digital technology?
Who is going to be using it?
When are they (or we) going to use it?
How is it going to be used?
And behind each of these questions, what justiication can we give for our
decisions? (Paul Goldenberg has written a really useful article for teachers,
which elaborates on these questions (Goldenberg 2000)).
The importance of your wider aim or vision for the development of your
use of ICT is the most crucial factor in determining the classroom outcomes. The research evidence suggests that, where the teachers have a clear
vision for their developing use of digital technology, they are in a better
position to evaluate how it does (or does not) impact on their students’
learning. For example, during 2007–2008, seven pairs of teachers from different English state schools began to use TI-Nspire software and hand-helds
(Texas Instruments 2007) with Key Stage 3 and 4 learners. From the outset
of the project they agreed their own vision for how they envisaged their
students’ engagement with mathematics using this technology. Cindy and
Linda, who taught in a girls’ school, decided that they wanted their students
to use the technology to promote their mathematical discussions and began
to devise lesson activities to this aim. An early lesson that they devised was
Triangle angles [DCH2] which emulated a ‘traditional’ exploratory task
whereby students draw a series of different triangles on paper, measure the
interior angles and tabulate and sum each triangle’s interior angles to arrive
at a generalization for all triangles.
Figures 27.1 and 27.2 show the screens of the task they designed, which
required the students to use the technology to measure the interior angles
and then input these measurements into a spreadsheet page to observe the
resulting angle sums for each of the four given triangles. The teachers were
seeking to overcome the dificulties that many students have with accurately
measuring angles in the paper and pencil environment.
When Cindy and Linda relected on this lesson, they appreciated that the
activity had not seemed to stimulate great mathematical discussion among
Supporting Teachers and New Technologies
Figure 27.1
[DCH2(tns-T) Page 2]
Figure 27.2
[DCH2(tns-T) Page 3]
253
the students and we discussed this. Essentially, the students had the same
four triangles and would be expected to obtain identical measurements.
They also acknowledged that, by attempting to ‘translate’ a familiar paper
and pencil task to a technological environment, although the technology had
automated the angle measuring process, they had not appreciated the power
of the technology. It would have been possible for them to drawn a single
triangle and, by measuring its angles, students could have explored many
254
Mathematics Education with Digital Technology
different cases by dragging its vertices and observing the data, captured and
displayed in the spreadsheet. This is shown in Figures 27.3 and 27.4.
There are two important things to learn from this example.
1. Most teachers begin by ‘translating’ familiar tasks and activities to a
technological environment. This is perfectly reasonable thing to do!
However, if, as Linda and Cindy learned, the lesson did not seem to be
Figure 27.3
A dynamic triangle
Figure 27.4
The captured angle data
Supporting Teachers and New Technologies
255
worth the effort, many teacher then give up on the technology and revert
to the less risky approach which is the paper and pencil one or choose to
demonstrate the activity to the class themselves. By rethinking the task
completely, a more engaging lesson was developed which enabled the
students to have a hands on experience.
2. Cindy and Linda needed to know that it was possible to drag the triangle
dynamically and measure its angles automatically in the spreadsheet.
This required them to develop their own personal skills with the technology in a supported environment – something that would normally happen in some form of professional development opportunity.
Conclusion
Learning to use technology for teaching is not the same as learning to
use technology for ourselves. There is an additional layer of consideration which involves us thinking about underlying pedagogy we want to
adopt and the way in which we select or design a task for our students.
Knowing what is possible with the technology changes the decisions that
we make.
References
Goldenberg, P. (2000). ‘Thinking (and talking) about technology in math classrooms’. Available online at: www2.edc.org/mcc/pdf/iss_tech.pdf (accessed on
14 December 2009).
Goldenberg, P. and Cuoco, A. (1998). ‘What is dynamic geometry?’. In R. Lehrer
and D. Chazan (eds) Designing Learning Environments for Developing Understanding
of Geometry and Space, pp. 351–67. Hillsdale, NJ: Lawrence Erlbaum.
Kaput, J. (1986). ‘Information technology and mathematics’. Journal of Mathematical
Behavior, 5 (2) 187–207.
Laborde, C. (2001). ‘Integration of technology in the design of geometry tasks with
cabri-geometry’. International Journal of Computers for Mathematical Learning, 6 (3),
283–318.
Monaghan, J. (2004). ‘Teachers’ activities in technology-based mathematics lessons’. International Journal of Computers for Mathematical Learning, 9, 327–57.
Noss, R. (1998). ‘New numeracies for a technological culture’. For the Learning of
Mathematics, 18 (2), 11.
Noss, R. and Hoyles, C. (1996). Windows on Mathematical Meanings: Learning Cultures
and Computers. Dordrecht, The Netherlands: Kluwer Academic Publishers.
Noss, R., Sutherland, R. and Hoyles, C. (1991). ‘Final Report of the Microworlds Project Vol II: Teacher attitudes and interactions’. London: Institute of Education.
256
Mathematics Education with Digital Technology
Papert, S. (1980). Mindstorms: Children, Computers, and Powerful Ideas. New York: Basic
Books.
Pope, S. (2001). Handheld Technology Project. Coventry: British Educational Communication and Technology Agency.
Ruthven, K. and Hennessy, S. (2002). ‘A practitioner model for the use of computerbased tools and resources to support mathematics teaching and learning’.
Educational Studies in Mathematics, 49, 47–88.
Texas Instruments. (2007). TI-NspireTM, Dallas, TX: Texas Instruments Inc..
Chapter 28
Implications for Professional
Development: Supporting Individuals
Pip Huyton
NCETM Consultant
Introduction
Mathematics teachers today are expected to keep up to date with current
educational initiatives, pedagogical thinking and to have sound mathematical knowledge. The most recent revision of the National Curriculum, to
one based upon key processes and concepts, is one example of the challenges for teachers to rethink the way they and their learners interact in the
classroom. Traditionally, professional development for teachers has been
provided through courses; many of which occurred during the school day,
were held in venues determined by the providers, and were limited in their
potential for continuous development. The introduction of digital technologies has provided alternative methods of communication which allow
opportunities for teachers to engage in continual professional development 24/7 and for 365 days of the year – providing the personalized lexibility in how, when and where the professional development is accessed, via
their PC with internet connection. All of the new technologies mentioned
here are freely available via the internet and are therefore accessible for all
teachers at all times.
Digital technologies which have, in my experience in working with individuals and networks of teachers, been signiicantly useful in supporting
the contemporary professional development of teachers may be classiied
as the 3Vs. They are
z
z
z
Video Capture
Virtual Real Time meetings
Virtual Communities.
258
Mathematics Education with Digital Technology
Video Capture
One example of video capture software is Jing, a TechSmith free download:
www.jingproject.com.
For many individuals a multi sensory approach can enhance their learning experience. For the teachers’ professional development to have an
impact in the classroom the learning experience needs to be positive and
supportive. A video capture includes pictures, sounds and words which
together create a detailed explanation of an activity; providing an experience which the teacher can then personally put into practice.
The software allows the user to record events that occur on the desktop
of their PC and then save the recording either as a ile onto a drive of the
PC or to a TechSmith server which then generates a web link. There then
exists an opportunity to share the ile with other teachers in the department, the locality or the wider mathematics community. The video capture
is most effective when it is brief, focussed and a snapshot of an event. Experience has shown it has great potential in supporting the development of
Information and Communications Technology (ICT) in the teaching and
learning of Mathematics.
A ‘how to’ video capture has been a particularly useful application of the
technology. For example, a recording of how to use speciic features of mathematical software for teachers could be a development of their own skills in
using the software, and also can be used as an aide-memoire for students
working with the software in the classroom. Being able to replay (and pause)
the video as often as required with instant access supports the individual at
all times. Inserting the link to the video capture in any relevant electronic
documents establishes an immediate connection if required; teachers found
this helpful when preparing materials for students of differing abilities.
A ‘this is how we did it in the classroom’ video capture is another positive
use of the technology. Teachers are able to easily narrate recordings that
demonstrate how an activity developed in their classroom as an example to
share with others and jointly analyse. The recording can demonstrate the
questions asked, whether oral or written, the sequence of the events, the
responses from learners and the way in which the software aids the learning. The power of this recording for professional development is in its analysis and consideration of what else might have been done. For example,
what other questions might the teacher have asked? Would the learning
experience be improved by re-ordering the events? How could we engage
the learners more? The advantage of this type of video capture is that it is a
brief resume of a lesson which teachers can ind time to watch.
Implications for Professional Development
259
Virtual Meeting Rooms
One example of a free virtual room is provided by Elluminate: www.elluminate.
com.
In the virtual meeting room teachers can log in at an agreed time to
‘meet’ their colleagues or learners without having to move away from their
internet connected PC. In built features such as webcam and audio allow
users to see, hear and speak to each other on-line, while screen sharing
enables users to view and, with permission of the user, take control of other
users’ desktops. The combination of features therefore provides a platform
for genuine distance learning and communication. Teachers have been
able to bring colleagues and learners ‘virtually’ into their room. The real
time experience allows for questions and answers to be instantaneous within
the group of users.
The ‘never too far’ virtual meetings are particularly beneicial for teachers from different schools wishing to work collaboratively on an activity.
Quality resources are often a by-product of professional development, being
created as a result of teachers’ ideas being expanded, trialled in the classroom, relected upon and then appropriately modiied – this requires
repeated communication between teachers developing such resources.
Being able to ‘virtually’ meet facilitates the collaboration of the teachers on
a more frequent or regular basis, particularly when the location of the teachers is dispersed. In the virtual room, all teachers simultaneously view the
same item, allowing for questions like ‘can you just explain’ and ‘can you
show me how you did’ to be immediately answered, before the thought is
lost. Documents can be annotated, amended and then saved for all users to
access.
The ‘have you thought of’ virtual meetings enable teachers to directly
link to a colleague with a different skill set or perspective, which may result
in the exploration of new ideas and methods or improved subject knowledge. This was the case when small groups of students, supervised by their
member of staff, ‘virtually’ met as part of a G&T student network. An outcome of the meetings was that peer to peer learning took place which
included one group demonstrating how, in that particular case, Dynamic
Geometry software allowed the students’ mathematics to be developed further than the pencil and paper method used by another group. As a result
of this interaction one of the teachers identiied a speciic PD need, namely
how to use the software that was already installed on the school network.
In addition the teacher had established an initial point of reference for
professional advice.
260
Mathematics Education with Digital Technology
Virtual Communities
The web portal of The National Centre for Excellence in the Teaching of
Mathematics (NCETM) www.ncetm.org.uk is one free provider of a platform for collaboration through its communities.
Online communities, or forums, provide a virtual space in which teachers
can observe, learn and share. Teachers can engage with each other, and the
forum facilitates networking. Teachers can ask and respond to questions;
contribute to the making and sharing of resources; challenge and be challenged in their mathematical knowledge and pedagogy. This can occur with
an invited group of mathematicians in a closed/hidden community or with
the wider mathematics society in an open community.
Conclusion
A ‘what makes it work’ community encourages teachers to relect on their
practice, analysing all aspects of their role in the classroom for example,
what they did, what they said, who they worked with and what equipment
was used. The outcome of engaging with a community for teachers is a
greater appreciation of the variety of practice beyond their own school.
This in most cases motivated teachers to step out of their comfort zone and
to try alternative methods, which increased their personal conidence.
Examples of this are communities that worked with the materials developed, under the leadership of Malcolm Swann, entitled ‘Improving Learning in Mathematics’. The individual teacher can access a community and
within that community identify or create a topic of discussion linked to a
key personal interest. Comments posted within the topic may assist the
teacher in obtaining helpful advice or possible solutions to issues such as
‘how can I use the IWB more interactively in the classroom?’ or ‘how can I
adapt an activity to work with only one computer in the classroom?’
Through a combination of the 3Vs teacher can be facilitators and learners
within any collaborative community that provides access to regular CPD.
Finally, while there are signiicant advantages to be gained by using the new
technologies as part of the teachers’ professional development the element
of personal interaction of the traditional methods for CPD is still valued.
Chapter 29
What Are the Signiicant Factors
Which Support the Integration of ICT in the
Mathematics Classroom?
David Wright and Pam Woolner
Research Centre for Learning and Teaching (CfLAT), Newcastle University, UK
Introduction
The introduction of interactive whiteboards into classrooms has seen an
increasing use of Information and Communications Technology (ICT) by
teachers. However, this may mean that students are getting fewer opportunities to use ICT individually or in small groups (Smith et al., 2006). Where
this does happen, it frequently involves booking a special ‘computer lab’,
reducing the frequency and ‘ad hoc’ use of ICT as part of the mathematics
classroom.
Several years ago, inspection evidence showed that most pupils had some
opportunities to use ICT as a tool to solve or explore mathematical problems. This is no longer the case; mathematics makes a relatively limited
contribution to developing pupils’ ICT skills. Moreover, despite technological advances, the potential of ICT to enhance the learning of mathematics is too rarely realised. (Ofsted, 2008) p. 17.
In the secondary schools, the two main problems were the lack of ICT
resources and weaknesses in identifying suitable activities at key points in
schemes of work. (Ofsted, 2008) p. 18.
We investigated the impact on teachers and students of the introduction of
small software applications on hand-held technology (graphical calculators or
GCs)in the mathematics classroom. The study (Wright and Woolner, 2009),
supported by a grant from NCETM, was a two year enquiry which began in
June 2007 with the delivery of the GCs and was completed in March 2009.
262
Mathematics Education with Digital Technology
Background
We believed that graphical calculators could be useful ICT tools which can
be put into the hands of every student in a mathematics lesson without having to take the class off to the ICT suite. This seemed appealing because the
calculators are able to run versions of the small software, sharply focused on
speciic topics, which is established as a useful resource to support learning
in mathematics. Speciic examples include the SMILE software (www.bebc.
co.uk) and ATM programs (www.atm.org.uk).
As this demonstrates, graphical calculators can be used for rather more
than graph-plotting (Hennessy, 1999; Wright, 2004) and recent technological developments also make it possible to network calculators together,
allowing pupils and teachers to share an interactive space.
The teachers were supplied with a GC emulator (TI Smartview©), which
allowed them to model the GC on their PC and project the image on to a
whole class display, facilitating explanations and the modelling of procedures. A later addition to the project is a networking system, the TI Navigator©,
which allows the GCs to be linked to each other and to the teacher’s PC so
that data and images can be shared and ‘screen shots’ from the GCs projected on to the whole class display.
The initial approach to the use of the technology via small software was
chosen as the most accessible and motivating route into its use. This approach
was chosen since we hypothesized that the adoption of new technology by
teachers and learners is most successful where it does not involve a big commitment initially in learning about its functionality, where the application
its in well to teachers’ existing practice and where there is an immediate
gain in ‘value added’ to the learning of the students. However, we were aware
that this approach may lack challenge and fail to have an impact on classroom practice. Thus some episodes of outside training were also offered.
The two mathematics teachers centrally involved in the project were
interested in the potential of the GCs, but had no previous experience of
using such technology in their teaching. They were given GCs and some
initial training (mainly focused on how to load and run small software on
the GC) in the summer term 2007, then used them in class from September
2007. The Navigator networking device was delivered to them during this
irst term and they received training on it in February 2008 and began to
use it in their lessons from that date.
Throughout the project, we worked with the teachers and students to investigate their experiences of using the hand-held technology for mathematics
Signiicant Factors
263
teaching and learning. Data was gathered through informal interviews and
meetings, classroom observation, teacher diaries and pupil questionnaires.
Learner’s Perspective
There was an initial, consistent perception among the learners that the use
of the GCs in their lessons was beneicial. This impression was supported by
observation of lessons, including informal comments made by the students,
and corroborated the opinion of the teachers that the GCs were generally
well received by their classes.
It was anticipated that the GCs would have a wider impact on learning,
perhaps stimulating problem solving and higher level talk around mathematics. During lessons observed early on in the project, much of the talk
between teacher and learners and between learners seemed to concern the
practicalities of using the GCs (e.g., ‘Where’s the timer?’) or speciic, fairly
low level requests for help (e.g., ‘What’s 0.98 x 9..?’). During later classroom
observations, a higher proportion of comments related to mathematics
were noted. For example, in a lesson using the graphical functions to
explore equations of lines, learners were heard discussing each others’
graphs, asking nearby students ‘How did you get that?’ and offering ideas to
the teacher:
‘If you divided by 2 would it be, like, the other way round?’
These observations support the frequently reported impact of the effectiveness of ICT in promoting conjecturing and experimentation, yet here they
are taking place in the context of the normal mathematics classroom and
lesson, not in the ICT suite.
As mentioned above, there are concerns that although ICT is present in
the contemporary mathematics classroom it is often limited to the IWB, and
so mainly used by the teacher. In this respect the provision of hand-held
technology for learners makes a clear difference. The pupil questionnaire
responses demonstrated that, from a fairly early stage, the GCs were being
used for a variety of mathematical topics. Even when the use of the GCs was
not particularly mathematically sophisticated, the learners seemed motivated, enjoying the challenge of, for example, problem-setting programs:
‘timing is fun against friends’
264
Mathematics Education with Digital Technology
Later lessons involved the use of the Navigator networking device. This use
of the Navigator produced some instances of ‘interactive whole class teaching’, as well as learning, which seemed generally to engage all the learners.
The questionnaire responses show that the students found the mathematics activities which used the Navigator more memorable than those that
did not.
Teacher’s Perspective
The teachers’ initial reactions were favourable and the teachers found the
training on how to access the software particularly useful.
Very helpful session, I feel less intimidated at the thought of using the
calculators in the classroom with the students. The programs we saw were
excellent and I am looking forward to using them with the students.
seems at the moment to be a wonderful resource!
The potential for students to progress at their own pace was noted;
it was excellent for the higher ability pupils especially as they could progress at their own speed
It also seemed to motivate the students to work on what could be quite ‘dry’
material (arithmetical operations):
pupils probably did more examples than they usually would have.
The unfamiliar resource also caused some problems:
I am not able to get round the room quickly enough to support each
pupil as soon as they need help. Extra stafing would be nice.
I felt the lesson was a bit stressful as some pupils could not progress due
to technical problems.
This suggests that extra support should be made available when GCs are
introduced so that teething problems can be quickly dealt with. However,
these issues were outweighed by the initial positive impact in motivation
and enjoyment in learning afforded by the introduction of the GCs.
Signiicant Factors
265
I feel [the] motivation of [the] class and overall pupil enjoyment of maths
has increased dramatically using the calculators. Especially effective for
engaging boys who sometimes do little work in the lesson!
Teachers quickly noted that there was a need for another style of pedagogy
in using this facility.
I found the program is good for testing understanding, but I found it
hard to assess pupils understanding during the lesson due to pupils being
asked different questions.
Note though, that in contrast to a similar exercise using written work, the
students are no longer able to give each other ‘the answer’ without engaging
in some level of problem solving. Further work with students to relect on
how engage in peer support in these situations could increase this level of
interaction.
Later diary entries, particularly in the class where the students have ownership of the GC, suggest that the initial novelty has ‘worn off’ so that more
attention needs to be paid to the appropriateness of the activity.
The lesson was ok, but I’m now feeling that familiarity is breeding not
contempt, but certainly the novelty is wearing off and some pupils are not
working as hard as they could be. [However, it should be noted that a
classroom observer comments that the proportion of on-task behaviour
generally remains ‘pretty high’ even when there are problems.]
Additional beneits of access to this resource that were noted included
the lexibility afforded so that students who had been absent could be introduced to the resource and catch up at their own pace.
There was some additional dificulty in developing the use of the GC as a
‘tool’ which supported the students’ thinking, because both the teachers and
students were unfamiliar with this aspect of the technology. However, many
students remarked on the graph plotting facility as something they recalled
from using the GC. The technology also had its own limits, for example, it
was not possible to plot the graphs of ‘implicit’ functions without students
transforming them into the ‘y = ’ format which caused extra problems when
students were unable to perform the transformation accurately.
As the project progressed the teachers began to be curious about the
range of functionality of the GCs and the potential of the networking facility.
266
Mathematics Education with Digital Technology
The training offered in February addressed both of these issues and introduced the teachers to some ready-made classroom activities which could be
used with minimal development. This input was very well received:
We were ‘ired up’ again, and were impressed with how the calc’s can be
used to explore accuracy, fractions, standard form and algebraic identities.
Conclusion
There are a range of issues for further professional development here. Evidence from the teachers’ diaries noted that, despite their growing familiarity with the GCs, the learners’ response varied widely according to the
choice of activity and resource used. Some activities were extremely popular and students returned to their use voluntarily either in the classroom or
at home. Hence there is a need for both for teachers to become more
informed about the potential pedagogical value of particular activities and
also to be able to judge what that potential might be in the context of the
GC and how and when to mediate and intervene in the students’ activities.
The teachers are developing their experience in how and when the use of
this technology might be appropriate. Their diary entries demonstrate that,
despite the immediate, generally positive, impact of the technology, professional judgement and experience was being developed to support decisions
about when, how and whether to use this resource.
The combination of hand-held personal technology and a networking
system combines the advantages of the computer lab and projection technology to create a shared interactive space (digital workspace) in which to
do mathematics in the ordinary mathematics classroom. (Davis, 2003, Hivon
et al., 2008) In this context ICT can be used when the teacher and/or students choose to do so. In addition, students and teachers can share their
work or even all participate in the same activity where everyone can see the
whole class’s contribution. The ‘connected classroom’ also crucially supports the assessment and feedback process essential to supporting learners’
development.
What Has Been Learned?
1. Early adoption of technical innovations by ‘mainstream’ teachers
depends on:
Signiicant Factors
z
z
z
z
z
267
a relatively undemanding commitment initially in learning about its
functionality;
the application itting in well to teachers’ existing practice;
a perceived immediate gain in ‘value added’ to the learning of the
students;
readily available technical support to sort out any ‘hitches’;
including an ‘outside’ inluence to provide an initial ‘boost’ and to sustain the promotion innovative activities.
2. Planning: both ‘large scale’ schemes of work and ‘small scale’ lesson
planning is crucial for the sustained use of the technology. This has
implications for the allocation of time for professional development.
3. If teachers have a sense of ownership of the innovation and students
have personal ownership of the technology, the innovation is more likely
to be sustained.
References
Davis, S. (2003). ‘Observations in classrooms using a network of handheld devices’.
J. Comp. Assisted Learning, 19 (3) 298–307.
Hennessy, S. (1999). ‘The potential of portable technologies for supporting graphing investigations’. British Journal of Educational Technology, 30 (1) 57–60.
Hivon, L., Pean, M, Trouche, L. (2008). ‘From a network of calculators to collaborative construction in the class’. Lyon, France, University of Lyon. Repères-IREM
(2008,n°72) downloaded at http://ti-researchlibrary.com/Lists/TI%20Education%20Technology%20%20Research%20Librar y/Attachments/76/
CROME-Reperes_english.pdf (accessed on 6 February 2011).
Ofsted. (2008). Mathematics: Understanding the Score HMI 070063.
Smith, F., Hardman, F. and Higgins, S. (2006). ‘The impact of interactive whiteboards on teacher-pupil interaction in the national literacy and numeracy
strategies’. British Educational Research Journal, 32 (3) 443–57.
Wright, D. (2004). ‘Graphical calculators: tools for thought’. In Johnston-Wilder,
S. and Pimm, D. (ed.) ‘ICT for Secondary Mathematics’ Milton Keynes: Open University Press.
Wright, D. and Woolner, P. (2009). Small Software for Mathematics on Hand Held Technology. Downloaded at www.ncetm.org.uk/enquiry/5166 (accessed on 10 August
2009).
Glossary
AT
ATM
avi
Becta
BIS
bmp
CAS
CBL
CBR
CD-ROM
Curriculum
dimensions
D&T
DCSF
DES
DGS
DIUS
GC
gif
GSP
ICT
Attainment target see MA1,2,3,4
The Association of Teachers of Mathematics
Audio video interleave. A multimedia container format
introduced by Microsoft for video iles
British Educational Computing and Technology Agency
formerly NCET
Department for Business Innovation and Skills
File format used to store bitmap digital images
Computer Algebra system
Calculator based laboratory
Calculator based ranger
Compact disc containing Read only iles
7 Cross curricular themes
Identity and cultural diversity
Healthy lifestyles
Community participation
Enterprise
Global dimension and sustainable development
Technology and the media
Creativity and critical thinking
Design and technology
Department for Children , Schools and Families,
formerly the DES
See DCSF
Dynamic Geometry software
Department for Innovation, Universities and Skills now
part of BIS
Graphing Calculator
Graphics Interchange format a bitmap format used for
simple usually graphic images
Geometer’s sketchpad
Information and Communication technology
Glossary
IT
IWB
jpeg
KS1
KS2
KS3
KS4
KS5
LAN
LCD
MA
MA1
MA2
MA3
MA4
MB
Mb
NANAMIC
NCET
NCETM
NCTM
NLVM
OCR
OFSTED
OHP
OS
PC
PCMCIA
269
Information technology
Interactive Whiteboard
Commonly used method of compression for digital
photographic images. The Joint Photographic Experts
Group standard,
Key stage 1: 5-7 years
Key stage 2: 7-11 years
Key stage 3: 11-14 years
Key stage 4: 14-16 years
Key stage 4: 16-19 years
Local Area Network
Liquid crystal display
The Mathematical Association
Attainment target 1 Using and Applying mathematics
AT 2 Number and Algebra
AT 3 Geometry and Measures
AT 4: Statistics
Mega Byte. A measure of ile size equal to 1 million
Bytes or characters.
Megabit 1 million bits. One byte equals 8 bits (binary
digits). Download speeds are given in Mbps or megabits
per second.
National Association for Numeracy and Mathematics in
Colleges
See Becta
The National Centre for Excellence in the Teaching of
Mathematics
The National Council of Teachers of Mathematics (US)
The National Library of Virtual Manipulatives at Utah
State University
Optical character recognition
The Ofice for Standards in education, children’s
services and skills
Overhead projector
Operating system e.g. Linux, Windows XP, Vista...
Personal computer
Personal computer memory card international
association. These cards are used for computer memory
storage expansion
270
pdf
PLTS
QCA
QCDA
RAM
ROM
SSAT
STEM
swf
TDA
tiff
TIN
TTA
UMPC
URL
VDU
VGA
VLE
Glossary
Portable document format – a ile format developed by
Adobe Systems
Personal learning and thinking skills
Independent enquirers
Creative thinkers
Independent learners
Team workers
Self-managers
Effective participants
See QCDA
The Qualiications and Curriculum Development
Agency, formerly QCA
Random Access memory
Read only memory
Specialist Schools and Academies Trust
Science, Technology, Engineering and Mathematics
Small web format. A ile format used particularly for
animated vector graphics. Associated with Shockwave
Flash and Macromedia and Adobe,
The Training and Development Agency for schools,
formerly the Teacher Training Agency (TTA).
Tagged image ile format. A ile format for storing
images particularly for image manipulation operations
and OCR.
TiNspire handheld device and software
See TDA
Ultra mobile PC
Uniform Resource locator – web address
Visual display unit
Video Graphics Array
VGA connectors are used to connect PCs to data
projectors external monitors etc
Virtual learning environment
Index
3D 41, 76–80, 138–9, 216, 249
animation 50, 55, 93, 129, 150, 177,
179–80, 252
applet 16–17, 139, 197
articulating 57, 87, 93, 98, 103
assessment 17, 23–4, 33–4, 47, 61, 63, 69,
105, 116, 120, 124, 170, 205, 239, 266
black box 76, 82
blogging 109, 119, 129
CAD 129, 200
calculator 12–13, 25, 30–5, 122–4,
137, 213
CAS 124, 168–73
classroom response systems 12, 102
concept 3–6, 9, 16–20, 31, 46, 48, 53,
55–8, 63, 81–2, 85–6, 94–6, 101–4,
113, 115, 121, 137, 140, 211–12, 215,
226, 228, 233, 257
conjecture 20, 41, 76, 81, 129, 139,
234–7, 244, 247
connection 3–6, 10, 19–20, 31, 48, 93,
139, 223, 237
construction 32, 42, 76–82, 92, 95–6,
129, 140, 145, 149, 168, 216
correlation 208
creativity 4, 42, 43, 53, 118–19, 161,
221, 228
Cuisenaire 94
data logger 122, 125, 127, 130, 144,
163, 165, 180–1, 186, 188, 195, 201
digital camera 109, 123, 126–30, 140,
184, 197–9
digital image 31, 129, 131, 140,
158, 160
dynamic geometry 15–16, 24, 26, 30–2,
40, 41, 73, 76, 80–2, 88, 93, 135–45,
158, 160, 206, 215, 235, 242, 244,
249, 259
equivalence 64, 169
externalization 54, 56
forum 149–50, 155, 214, 260
function-based algebra 37, 61–7
games 47, 51, 57–8, 102–3, 113,
128–30, 148, 237, 245
golden ratio 145
GPS 119, 130, 195, 201
graphing calculator 14, 16, 34–7, 47,
62–6, 75, 124–6, 137–8, 140, 143–4,
161, 193, 205–8, 211, 215, 218, 236,
242–7, 261–4
Hawkeye 193
interactive whiteboard 1, 15, 30,
37, 46–9, 55–6, 101–2, 118, 125,
129, 135, 139, 143, 154, 157,
160–1, 213, 227, 231, 233, 251,
260, 261–3
internet 12, 23, 93, 109, 111, 114–15,
118–19, 127, 129–31, 135–6, 139,
144–5, 148, 151, 155, 214, 231, 236,
239, 251, 257, 259
Logo 30–1, 220–9
manipulative 95–6
mathematical processes 3, 25, 31, 77,
87, 137, 144, 161, 173, 181–2, 222,
235–6, 257
272
Index
meaning 3, 9–10, 40, 86, 92, 96, 226,
234, 252
memory 3–10, 54, 118
metaphor 95
microworld 220
modelling 6, 33–4, 51, 56, 63–5, 96,
127–30, 143–4, 163–73, 177, 178–81,
184, 187, 192–3, 196, 198, 200, 220,
226–9, 244–9, 262
Moore’s law 123, 130–1
neural associations 3–5
neuroscience 3, 9–10
online learning 115, 120, 148
pattern recognition 3–7, 10, 30–3,
225–8, 247
PDA 126
professional development 27, 40–3,
107, 113, 155, 158, 160–1, 185, 233,
239, 241, 255–60, 266–7
projectile 192–4
proof 41, 77, 93
pupil collaboration 102, 112, 120
range-inder 125, 143, 195, 237
regression 208–9
scaffolding 20, 54, 84–7, 103–4
Second Life 113
simulation 24, 55, 109, 112–13, 127,
149, 193, 226–7, 245
spreadsheet 30–3, 101–3, 118, 125–7, 135,
137, 150, 193–5, 215, 242, 244, 252–5
STEM 121, 127, 129, 175, 185–6,
191–2, 201
symbolic manipulation 65, 124
tablet 102–3, 127, 160, 201,
213–14
teacher collaboration 24–7, 160, 241,
248–9, 259–60
Teachers’ TV 139–44, 161, 164, 192,
195, 197, 235
theorem 40, 93, 138–9, 143
TI-Navigator 7, 10, 62, 65–6, 126,
262, 264
TI-Nspire 14, 20, 122, 126–7,
143, 164, 171, 193, 195, 200,
215–16, 252
trajectory 235
variable 17–19, 63–4, 75–6, 82, 91, 102,
164, 177, 199, 226–8
verbalization 50
video analysis 142, 177, 182, 184,
193, 196–8
video clip 47, 57, 101, 107, 109, 125,
129–30, 139, 142–3, 149–50, 158,
161, 179–84, 190, 195, 199, 200,
214, 235–8
virtual learning environment 1, 24,
142, 145, 214
virtual meeting room 259
virtual world 98, 112–13
visualization 3, 5, 7–10, 25, 31, 50,
55–6, 81, 138–9, 164, 216, 235
wiki 43, 149–50
 Curriculum and Instruction


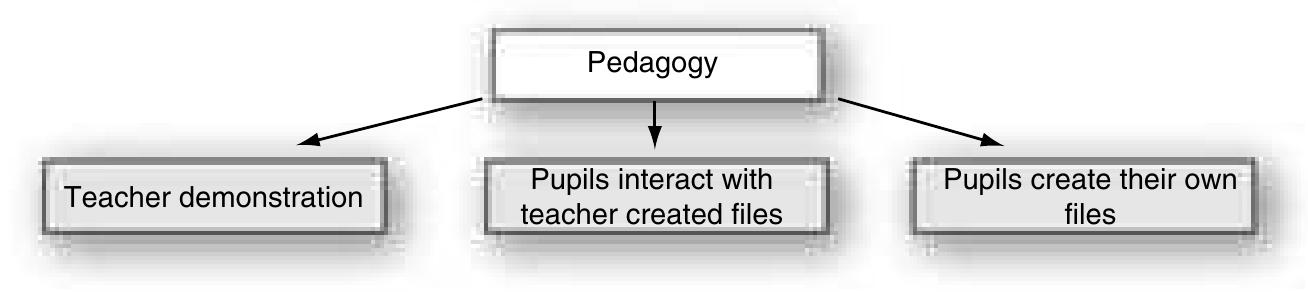


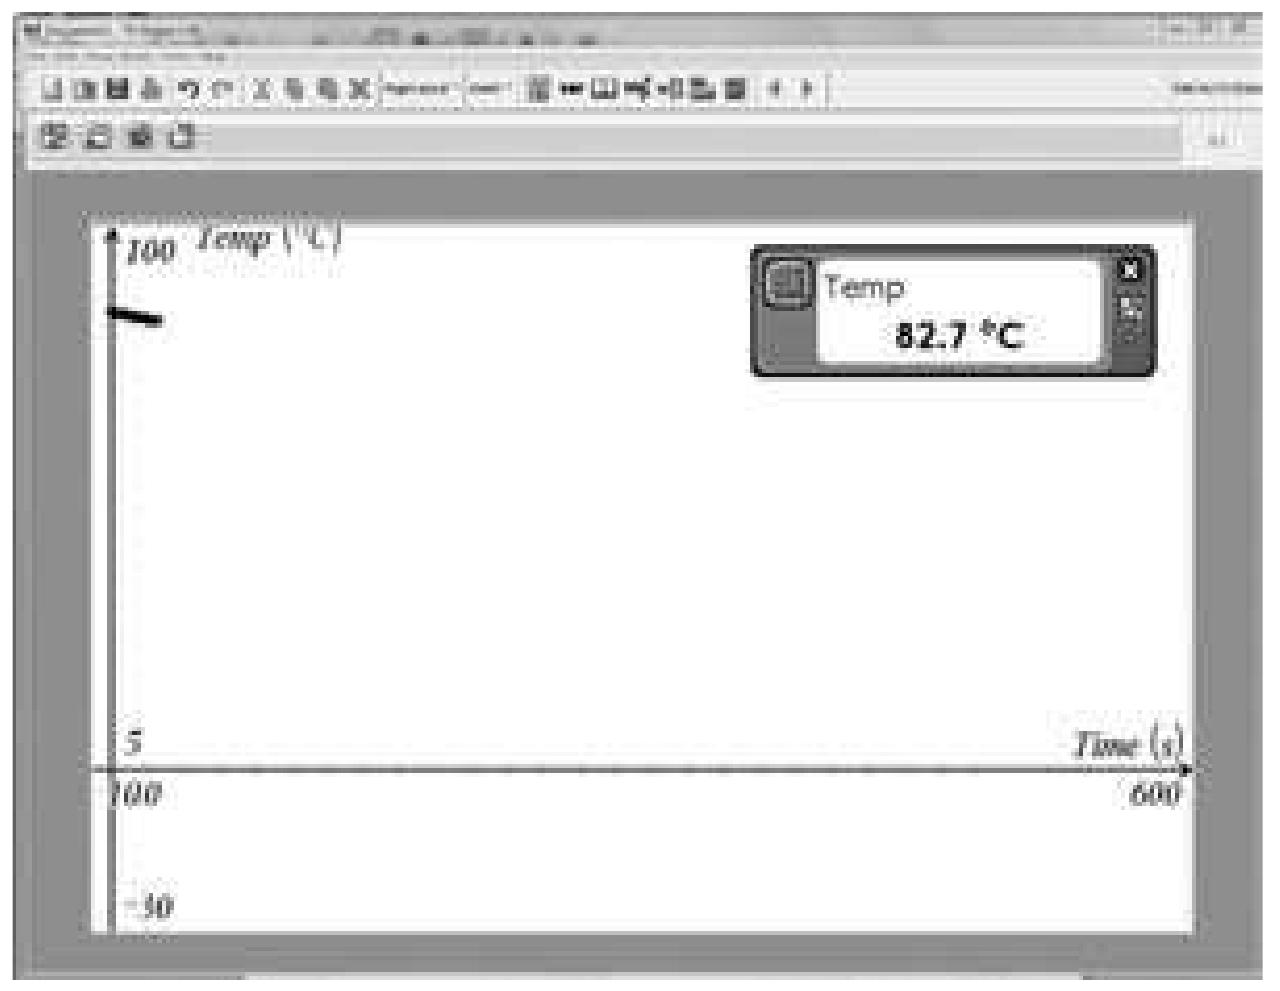


![FiGuRE 27.1 [DCH2(tns-T) Page 2]](https://figures.academia-assets.com/38815539/figure_070.jpg)


