580 California St., Suite 400
San Francisco, CA, 94104

Table 2 Parameter of the calibration functions equation (8) - (10) for the Minsk experiments: M1 - result of the test with the cylinder under pressure — see chapter 4,3,1 and M2 - results for the test with the cruciform sample - see chapter 4.3.2. The comparison of the 3D graphs in Fig.19 demonstrates that the usage of load values for establishing the 3D cali- bration graph, which are not identical to the real stresses at the measuring position, yield misleading implications. The left picture in Fig.19 describes the correct calibration graph with strong increasing values of the hydrostatic part BNA(o) with o = 0 = Oy — see also Fig. 18. The usage of the load values, determined by the strain gauges, gives a 3D graph (middle picture in Fig. 19) that implies an almost constant value for hydrostatic BNA part for o > 0. The right graph in Fig. 19 show the same behaviour but it is in con- tradiction with the findings of the autocalibration approach. Concerning this graph in Fig. 19, it is not correct to use the calibration curve from the cylinder test, since the materi- als are quite different as one can see it in Tab. 2.


![Table 1: By least square fit procedure the fit parameter of equation (1) were found by the author of [24], where the condition was utilized that for SL, = SL, the BNA value in both directions must be coincide](https://figures.academia-assets.com/115845159/table_001.jpg)
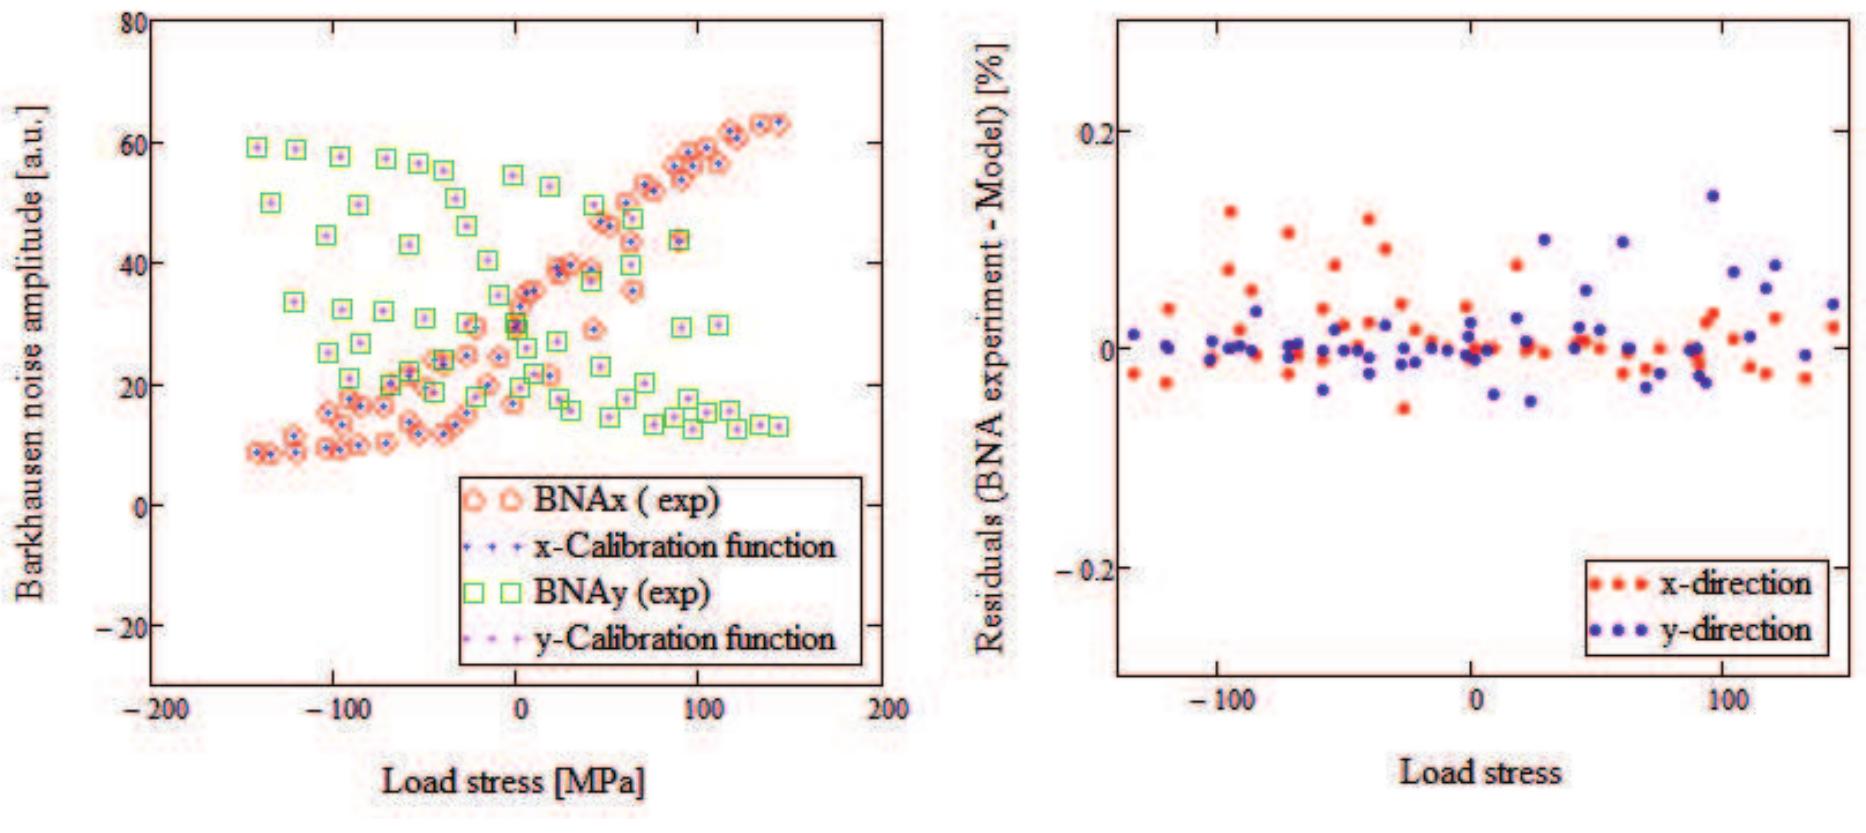
![Fig. 2. Results of the compression tensile test for five values of the load SL, in y-direction. The full lines represent the experimental values of the Barkhausen noise amplitude (BNA). The dotted lines belong to the calibration functions in equation (1) with the parameters shown in Tab. 1 approach was earlier used successfully for one dimension- al calibration. However, the calibration for the above-de- scribed biaxial test led to certain problems as it can be seen in Fig. 2. The reason for that is caused by the fact that the real load stress at the Barkhausen noise sensor does not agree with the value determined by the help of strain gauges — see Fig. 1. This is especially drastic in the case of tensile stress, may be the threaded rods of the facility are not completely coaxial and hence some bending or torsion could be oc- curred. However, it is difficult to clarify the reason for these deviations. The fit procedure for finding the stress values 6,, and Oy by the help of the Barkhausen noise amplitudes BNA in x- and y-direction of the magnetizing field was per- formed by a Mathcad program. Starting with initial values (Gi, Gy) = (100,100) [MPa] and suitable values for (A, A, K, ©) = (200, 80 [MPa], 0.5, 0.01) the solving block yield (On, Oy)” values in the first iteration stage. Then defin- ing the error function Err(A, A, K, C) because of this solving block and in a new solving block the parameters (A, A, K, C)](https://figures.academia-assets.com/115845159/figure_003.jpg)


![Fig. 10. Angle dependence of the BNA values for rotating magnetizing field direction. The theoretical BNA values were calculated by the calibration function equation (1) and using the relation (4) The experimental data are taken form the PhD thesis [24]. The stress values mentioned are given in [MPa]](https://figures.academia-assets.com/115845159/figure_011.jpg)
![Fig. 11. Left: Biaxial testing facility with manual regulation of tensile and compression load. The picture was taken from [12] with permission from the authors. Right: Schematic representation of the cruciform sample with the position of six strain gauges A biaxial test facility with a cruciform sample was used to prof the results with the cylinder — see Fig.11. During load- ing along the x-axis, the specimen position along the y-axis was rigidly fixed. The authors consider that this condition bring the test with the cruciform close to the practical situa- tion of tubes or pipes. Before starting each load run the strain gauges were balanced and the strain always started for all six strain gauges at the zero value. With the facility tensile and compression tests could be realized.](https://figures.academia-assets.com/115845159/figure_012.jpg)
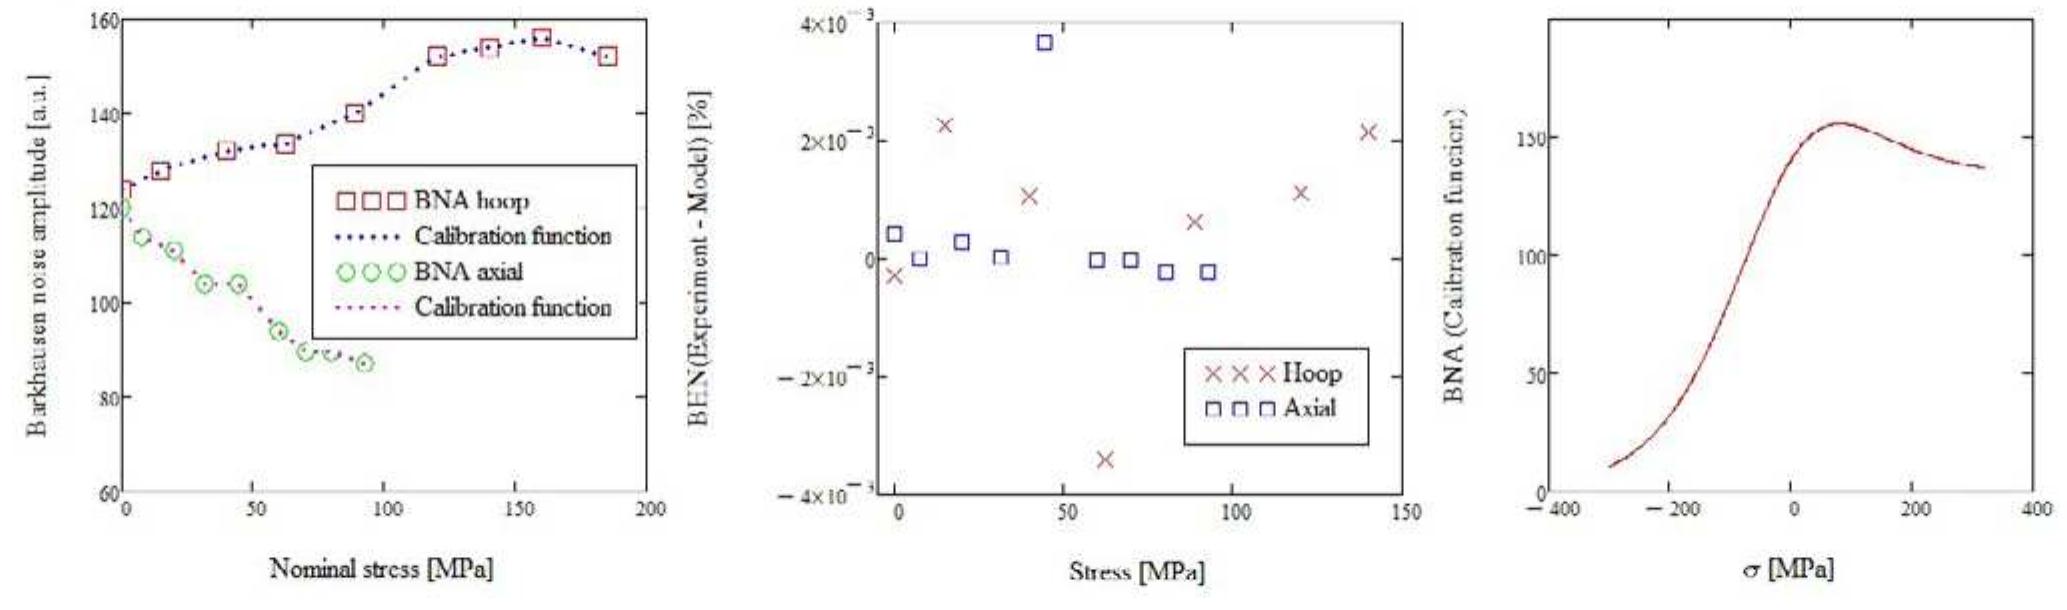
![Fig. 12. Measured BNA for the cylindric sample along the hoop V1(0,.) and axial direction V2(o,y). The polynomial trial functions are drawn for both directions. Nominal stresses were calculated by equation (6). The graph was taken from [12] with permission from the authors where p is the hydrostatic pressure in the pipe, D - the outer diameter of the cylinder and d—the wall thickness. Of course, this value belongs to the stress averaged over the whole wall thickness and uncertainties remain concerning the stress in a depth less than 1 mm, which is covered by the Barkhausen noise test. Measurements together with calibration functions are shown in Fig. 12. The calibration curves were modelled by a polynomial trial function of 6th order. Because of the behaviour of both functions V1(0) and V2(oy) a presumption was suggested that BNA values depend only on the difference of the stresses, ie, BNA yx, Oy) = f(O..—- Oy). The obtained calibration functions were used for analysing the data of the above-mentioned biaxial experiment with cruciform sample.](https://figures.academia-assets.com/115845159/figure_013.jpg)
![Fig. 13. Graphic illustration of complete biaxial calibration surfaces. Left: Measured BNA values for the cross shaped sample in a plane of the two stresses determined by the help of the measured strains along x-and y-directions. Left: The BNA-values are calculated by the calibration functions determined by the cylindrical test. The graphs were taken from [12] with permission from the authors](https://figures.academia-assets.com/115845159/figure_014.jpg)


![Fig. 20. Angle dependence of the Barkhausen noise amplitudes (radius) for rotating magnetizing field along 9-direction (azimuth). The BNA values were calculated by the calibration function equation (1) and using the relation (4) for various 0, but with fixed value o,, = 20 [MPa]. Index i designates the number of stress scan, which was chosen by trial](https://figures.academia-assets.com/115845159/figure_021.jpg)
